Fig. 5.
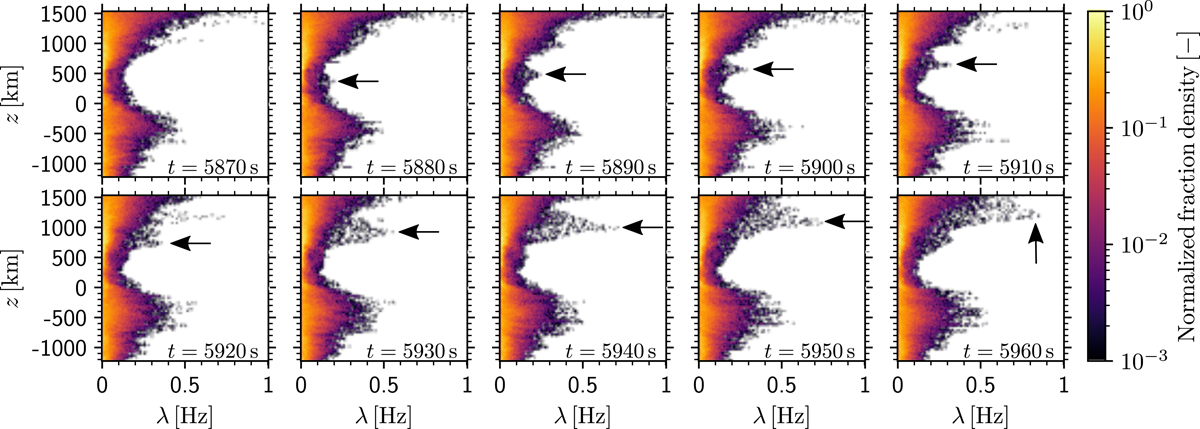
Time sequence of the swirling strength distribution. Each panel represents a bi-dimensional histogram normalized to the maximum density fraction at each height level z. The bin sizes are Δz = 10 km and Δλ = 3.62 × 10⁻³ Hz. These histograms refer to stacks of quadratic, plane-parallel cross sections of 1000 km side length centered on the swirl event of Fig. 4. Data points with λ < 2.09 × 10⁻² Hz are excluded. The black arrows point to the upward propagation of a local peak of swirling strength.
Current usage metrics show cumulative count of Article Views (full-text article views including HTML views, PDF and ePub downloads, according to the available data) and Abstracts Views on Vision4Press platform.
Data correspond to usage on the plateform after 2015. The current usage metrics is available 48-96 hours after online publication and is updated daily on week days.
Initial download of the metrics may take a while.