Fig. 3.
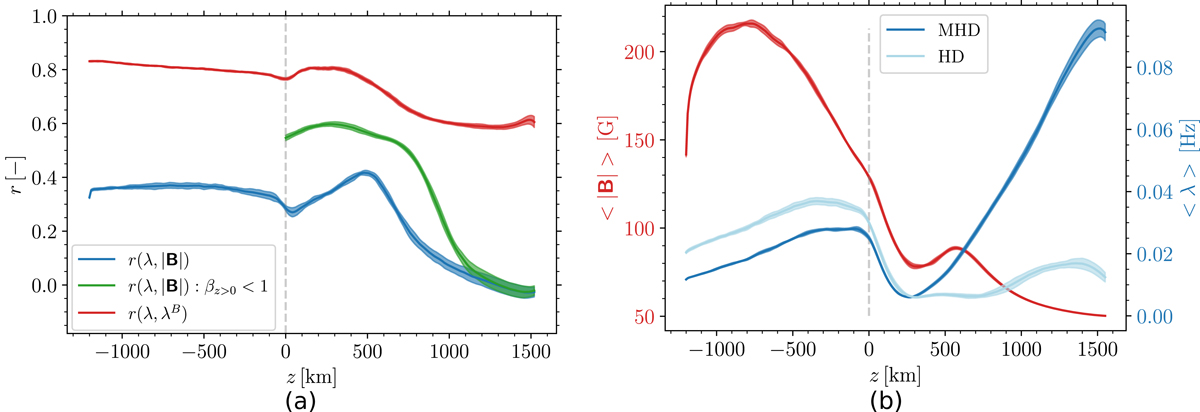
Statistical properties of swirling motions and mean physical quantities as a function of height z. (a) Spearman’s correlation coefficient r between the swirling strength λ and the magnetic field strength |B|, r(λ, |B|) in blue, and between the swirling strength λ and the magnetic swirling strength λB, r(λ, λB) in red. The green curve represents r(λ, |B|) calculated in regions in which β < 1 and above z = 0 only. The curves are means over eleven different time instants with a cadence of one minute and the shaded areas correspond to the standard deviations obtained from the temporal variations. Data points with λ < 2.09 × 10⁻² Hz are excluded. (b) Mean magnetic field strength ⟨|B|⟩ (red) and mean swirling strength ⟨λ⟩. The dark blue and red curves refer to the same MHD time instants as in (a), while the light blue curve refers to 14 time instants of a purely hydrodynamical simulation.
Current usage metrics show cumulative count of Article Views (full-text article views including HTML views, PDF and ePub downloads, according to the available data) and Abstracts Views on Vision4Press platform.
Data correspond to usage on the plateform after 2015. The current usage metrics is available 48-96 hours after online publication and is updated daily on week days.
Initial download of the metrics may take a while.