Fig. 11.
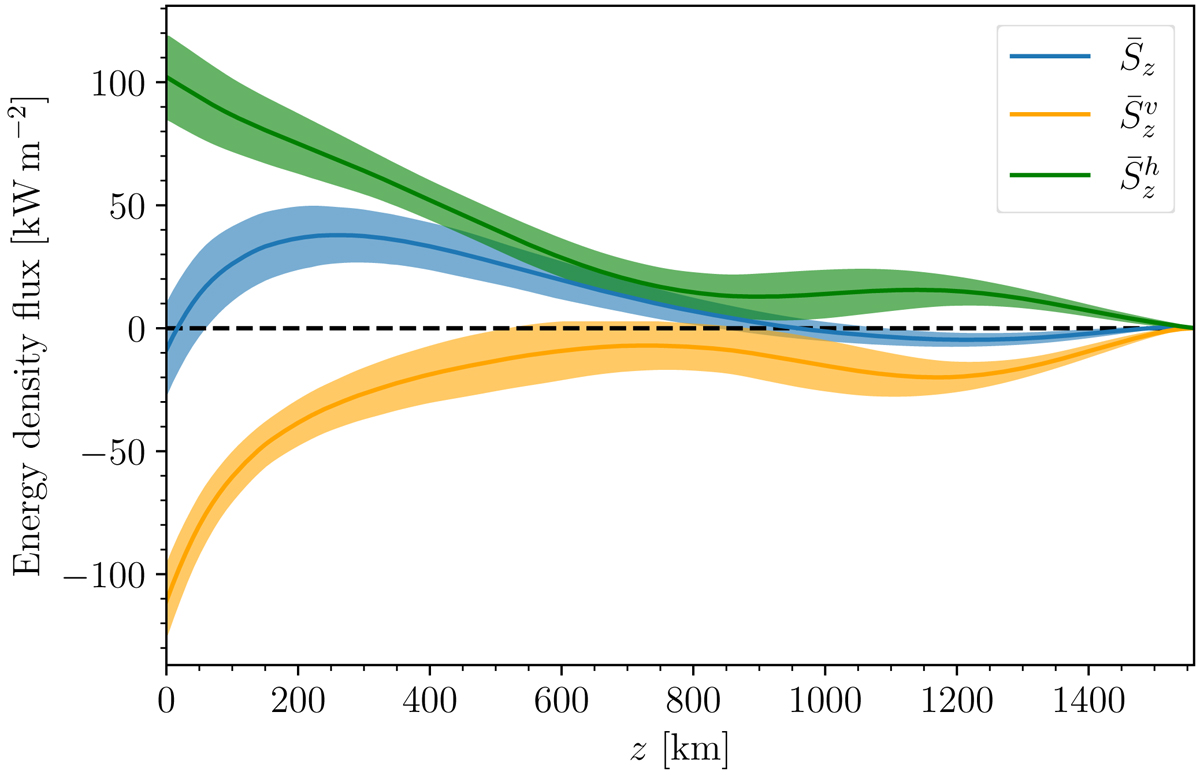
Mean vertical component of the Poynting flux vector Sz (blue) and of the terms ![]() (green) and
(green) and ![]() (orange) as a function of height z. The spatial mean is obtained by averaging over the horizontal cross sections of the full computational domain of 9.6 × 9.6 Mm2, while the temporal mean is computed from 21 different time instants spread over the time period of the high-cadence series of 15 min. The shaded areas correspond to the standard deviation obtained from the temporal variation.
(orange) as a function of height z. The spatial mean is obtained by averaging over the horizontal cross sections of the full computational domain of 9.6 × 9.6 Mm2, while the temporal mean is computed from 21 different time instants spread over the time period of the high-cadence series of 15 min. The shaded areas correspond to the standard deviation obtained from the temporal variation.
Current usage metrics show cumulative count of Article Views (full-text article views including HTML views, PDF and ePub downloads, according to the available data) and Abstracts Views on Vision4Press platform.
Data correspond to usage on the plateform after 2015. The current usage metrics is available 48-96 hours after online publication and is updated daily on week days.
Initial download of the metrics may take a while.