Fig. 9.
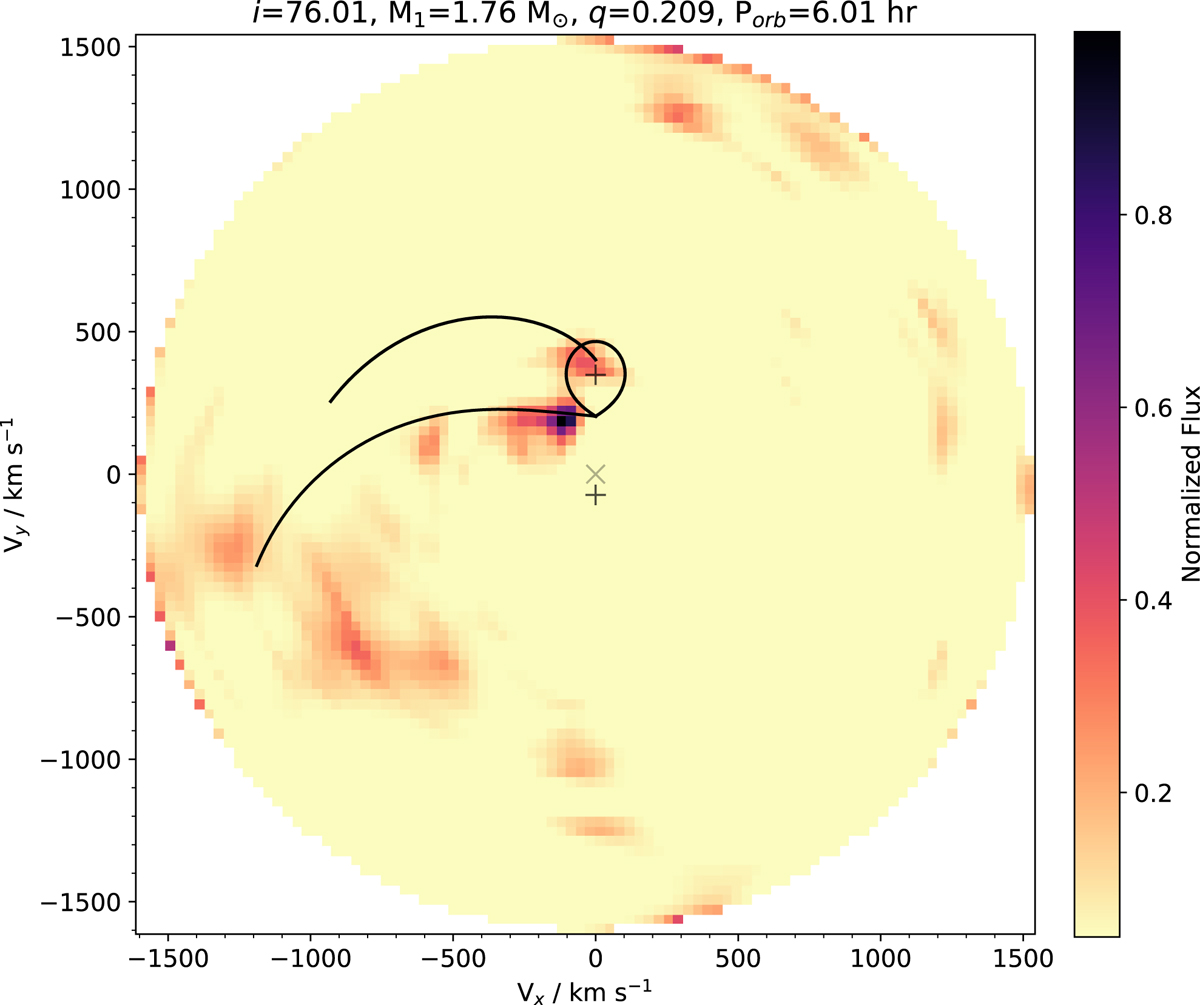
Doppler map of the Hα emission lines. We plot the gravitational free-fall gas stream trajectory (lower curve), the Keplerian disk velocity along the stream (upper curve) and the Roche lobe of the donor star using K1 = 72.7639 km s−1 (Deneva et al. 2016), i = 76° (Strader et al. 2019; Yap et al. 2019), MNS = 1.76 M⊙ and q = 0.209. The plus signs represent, from top to bottom, the companion and the NS, while the ‘×’ sign represents the center of mass. The map was computed for a systemic velocity γ = −10.5 km s−1.
Current usage metrics show cumulative count of Article Views (full-text article views including HTML views, PDF and ePub downloads, according to the available data) and Abstracts Views on Vision4Press platform.
Data correspond to usage on the plateform after 2015. The current usage metrics is available 48-96 hours after online publication and is updated daily on week days.
Initial download of the metrics may take a while.