Fig. 3.
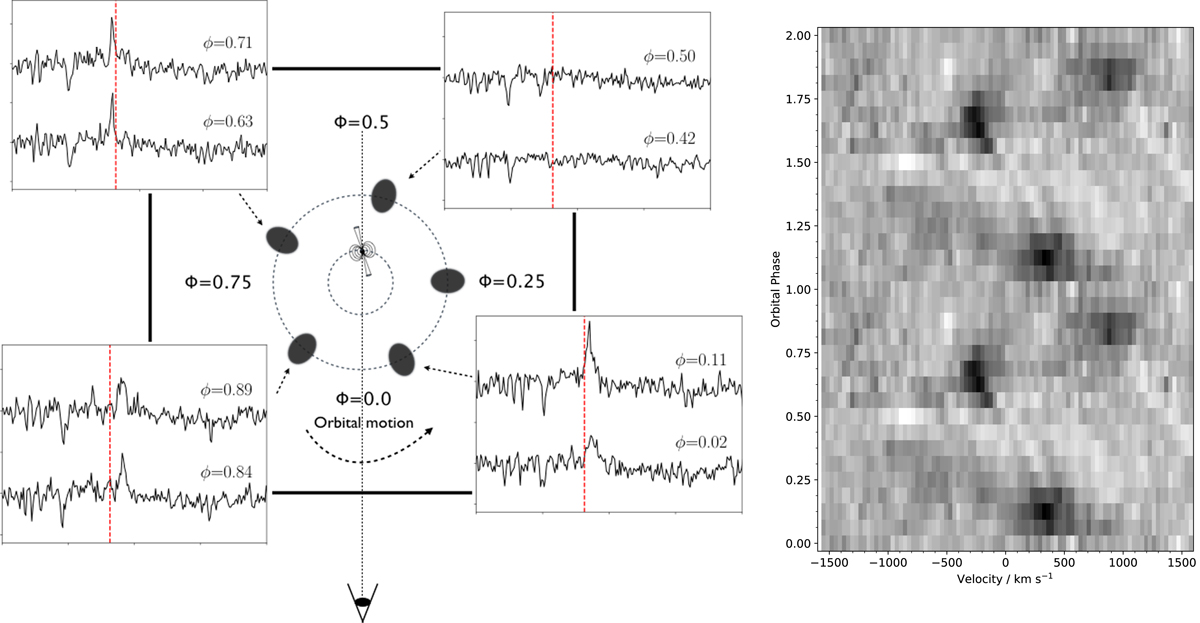
Left: a schematic panel of PSR J1048+2339 showing the orbital motion of the companion with Hα variability. The vertical red dashed line represents the Hα λ6561 rest wavelength. Right: trailed spectrum showing the orbital evolution of the Hα emission line. The spectra have been normalized to the continuum. Two cycles are shown for clarity.
Current usage metrics show cumulative count of Article Views (full-text article views including HTML views, PDF and ePub downloads, according to the available data) and Abstracts Views on Vision4Press platform.
Data correspond to usage on the plateform after 2015. The current usage metrics is available 48-96 hours after online publication and is updated daily on week days.
Initial download of the metrics may take a while.