Free Access
Fig. 10.
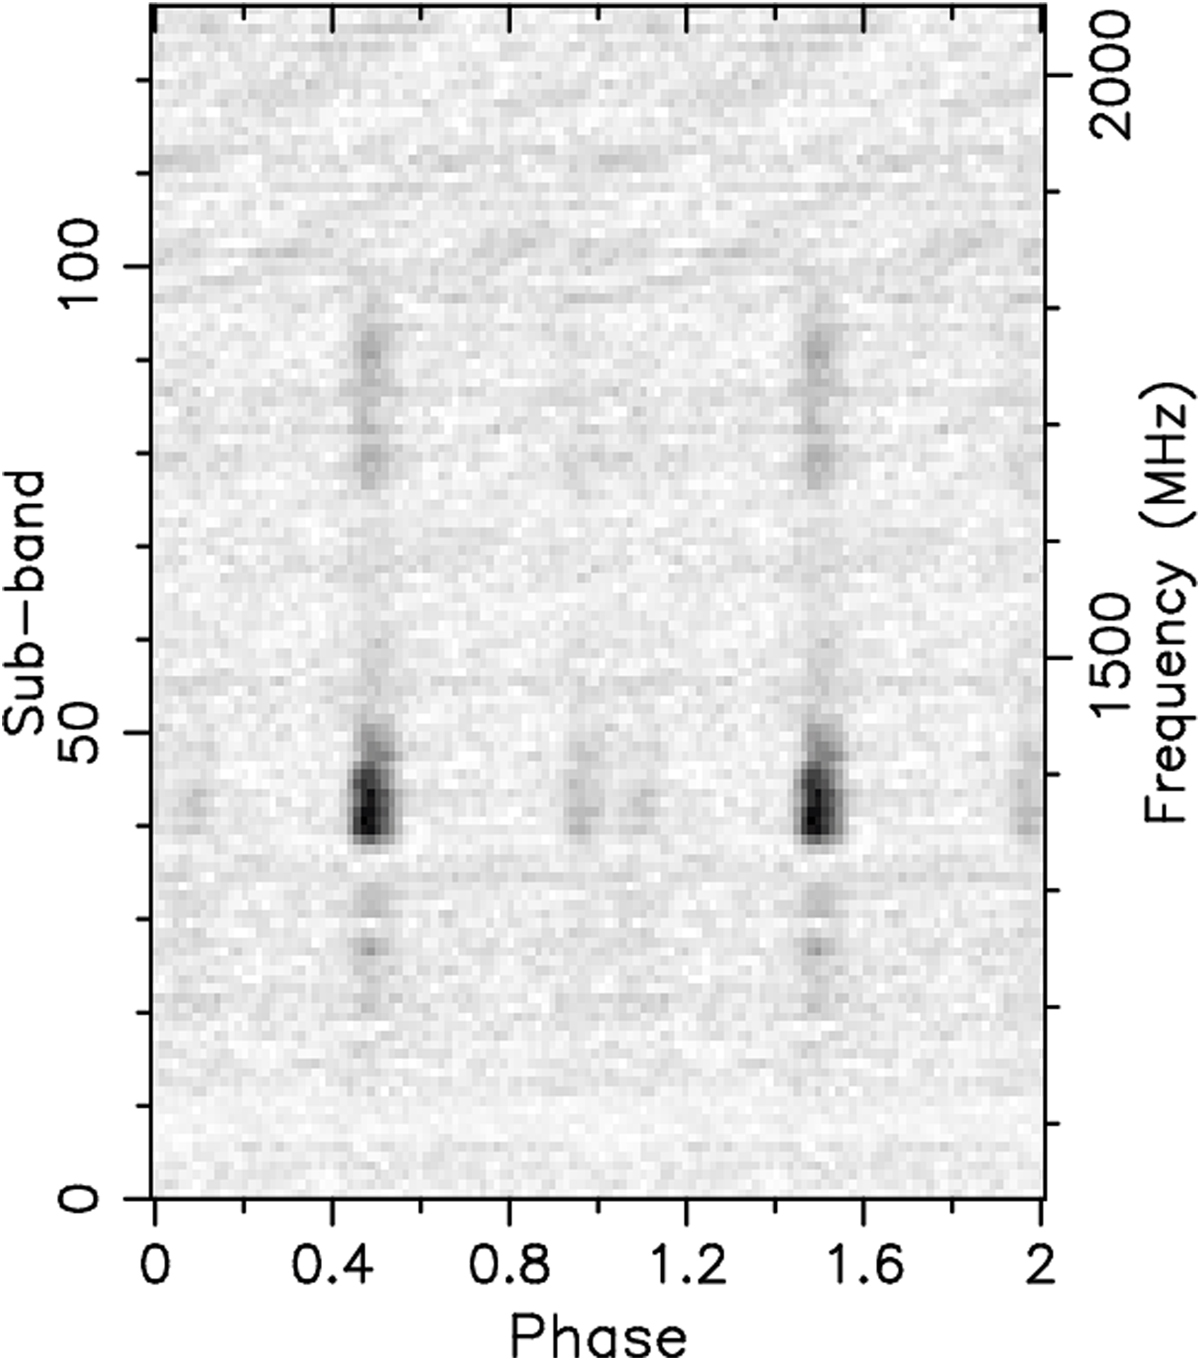
Intensity as a function of pulse phase (x-axis) and frequency (y-axis) for the SRT observation performed in the L band on 19 August, 2019. Signal strength is not constant at all frequencies. At ∼1.4 GHz there is a peak of intensity, while below 1.3 GHz and over 1.8 GHz the pulsed signal is almost absent.
Current usage metrics show cumulative count of Article Views (full-text article views including HTML views, PDF and ePub downloads, according to the available data) and Abstracts Views on Vision4Press platform.
Data correspond to usage on the plateform after 2015. The current usage metrics is available 48-96 hours after online publication and is updated daily on week days.
Initial download of the metrics may take a while.