Fig. 9.
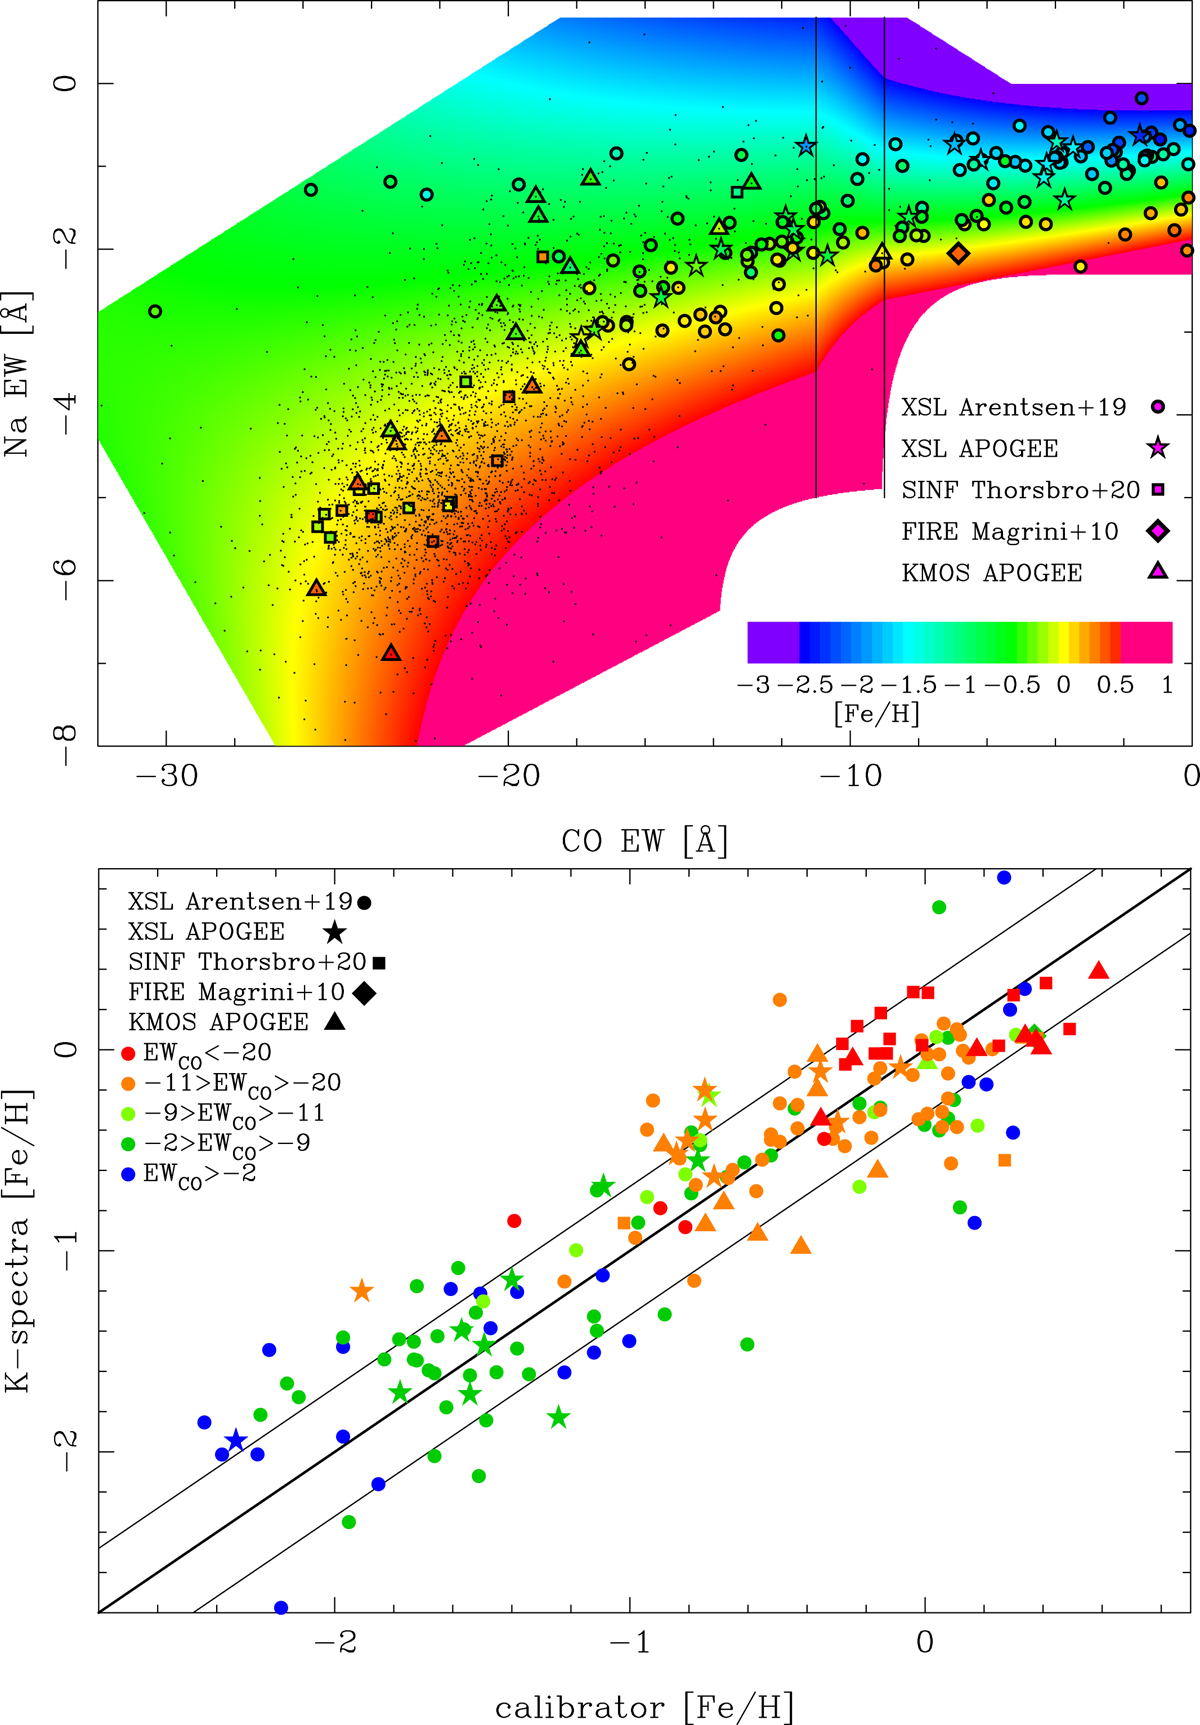
Metallicity derivation. Top: calibration of metallicity based on CO and Na EW. The large symbols represent the 183 used calibration spectra; the symbol shape shows the source of spectra and metallicity (Magrini et al. 2010; Thorsbro et al. 2020; Ahumada et al. 2020; Arentsen et al. 2019). The value is indicated by the color within SINF indicates SINFONI. The background shows the derived relation; the color range saturates below [Fe/H] < −2.5 and above [Fe/H] > 0.6 (the range of the calibrators.), where the derived values are based on more uncertain extrapolation. The two vertical lines separate the application of the high and low CO solutions; in the overlap region in between both high and low CO solutions are used to derive metallicities. The small dots show all our KMOS targets with S/N > 30 and a CO based velocity. The background shows the derived value only for areas where either calibrators or the nuclear stars have coverage. Bottom: comparison between literature (x-axis) and our metallicities (y-axis). The thick black line indicates the identity line; the thin lines bracket the typical uncertainty. Stars are coded by CO depth; the hottest have the smallest depth.
Current usage metrics show cumulative count of Article Views (full-text article views including HTML views, PDF and ePub downloads, according to the available data) and Abstracts Views on Vision4Press platform.
Data correspond to usage on the plateform after 2015. The current usage metrics is available 48-96 hours after online publication and is updated daily on week days.
Initial download of the metrics may take a while.