Free Access
Fig. 7.
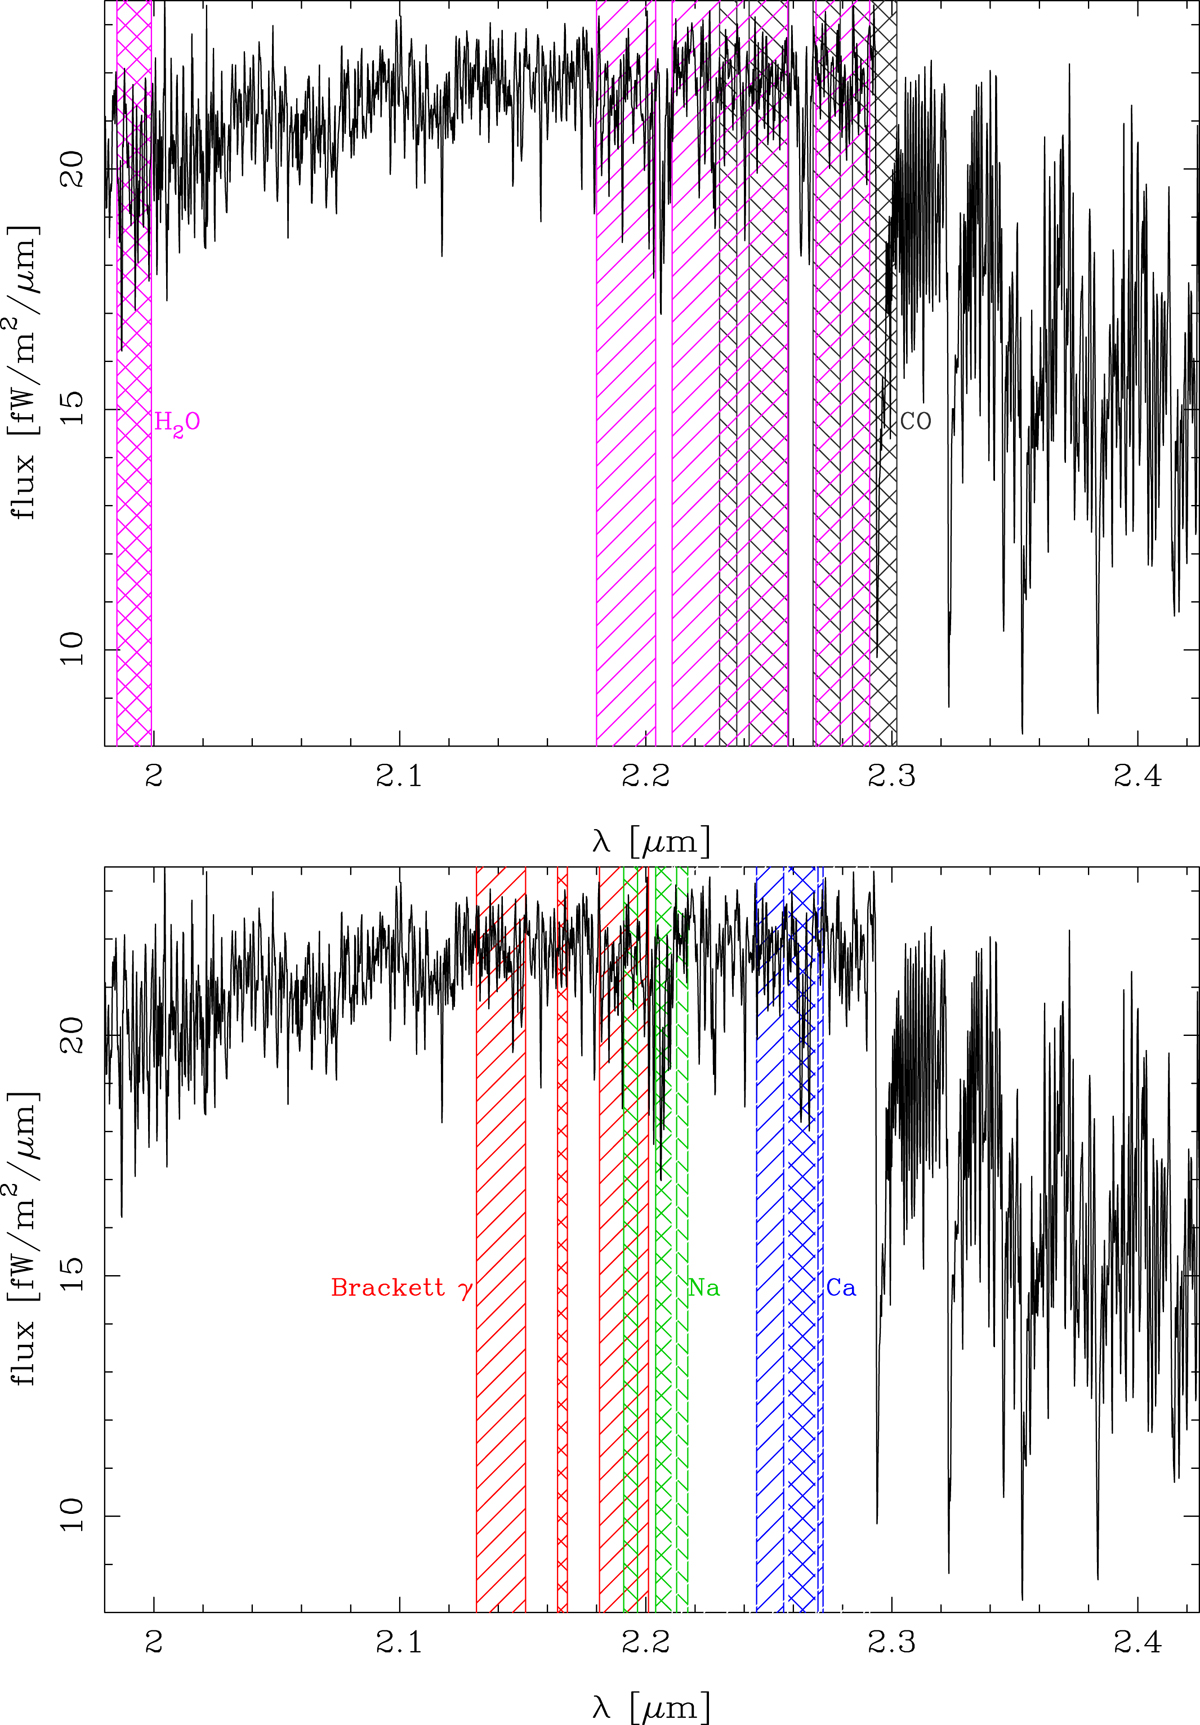
Index windows together with a typical spectrum. The continuum windows are shown hatched, the feature windows cross hatched. The spectrum is typical for a primary target spectrum in S/N and CO and Na index values. In the top panel the molecular indices are shown; in the bottom panel the atomic indices are shown.
Current usage metrics show cumulative count of Article Views (full-text article views including HTML views, PDF and ePub downloads, according to the available data) and Abstracts Views on Vision4Press platform.
Data correspond to usage on the plateform after 2015. The current usage metrics is available 48-96 hours after online publication and is updated daily on week days.
Initial download of the metrics may take a while.