Fig. 12.
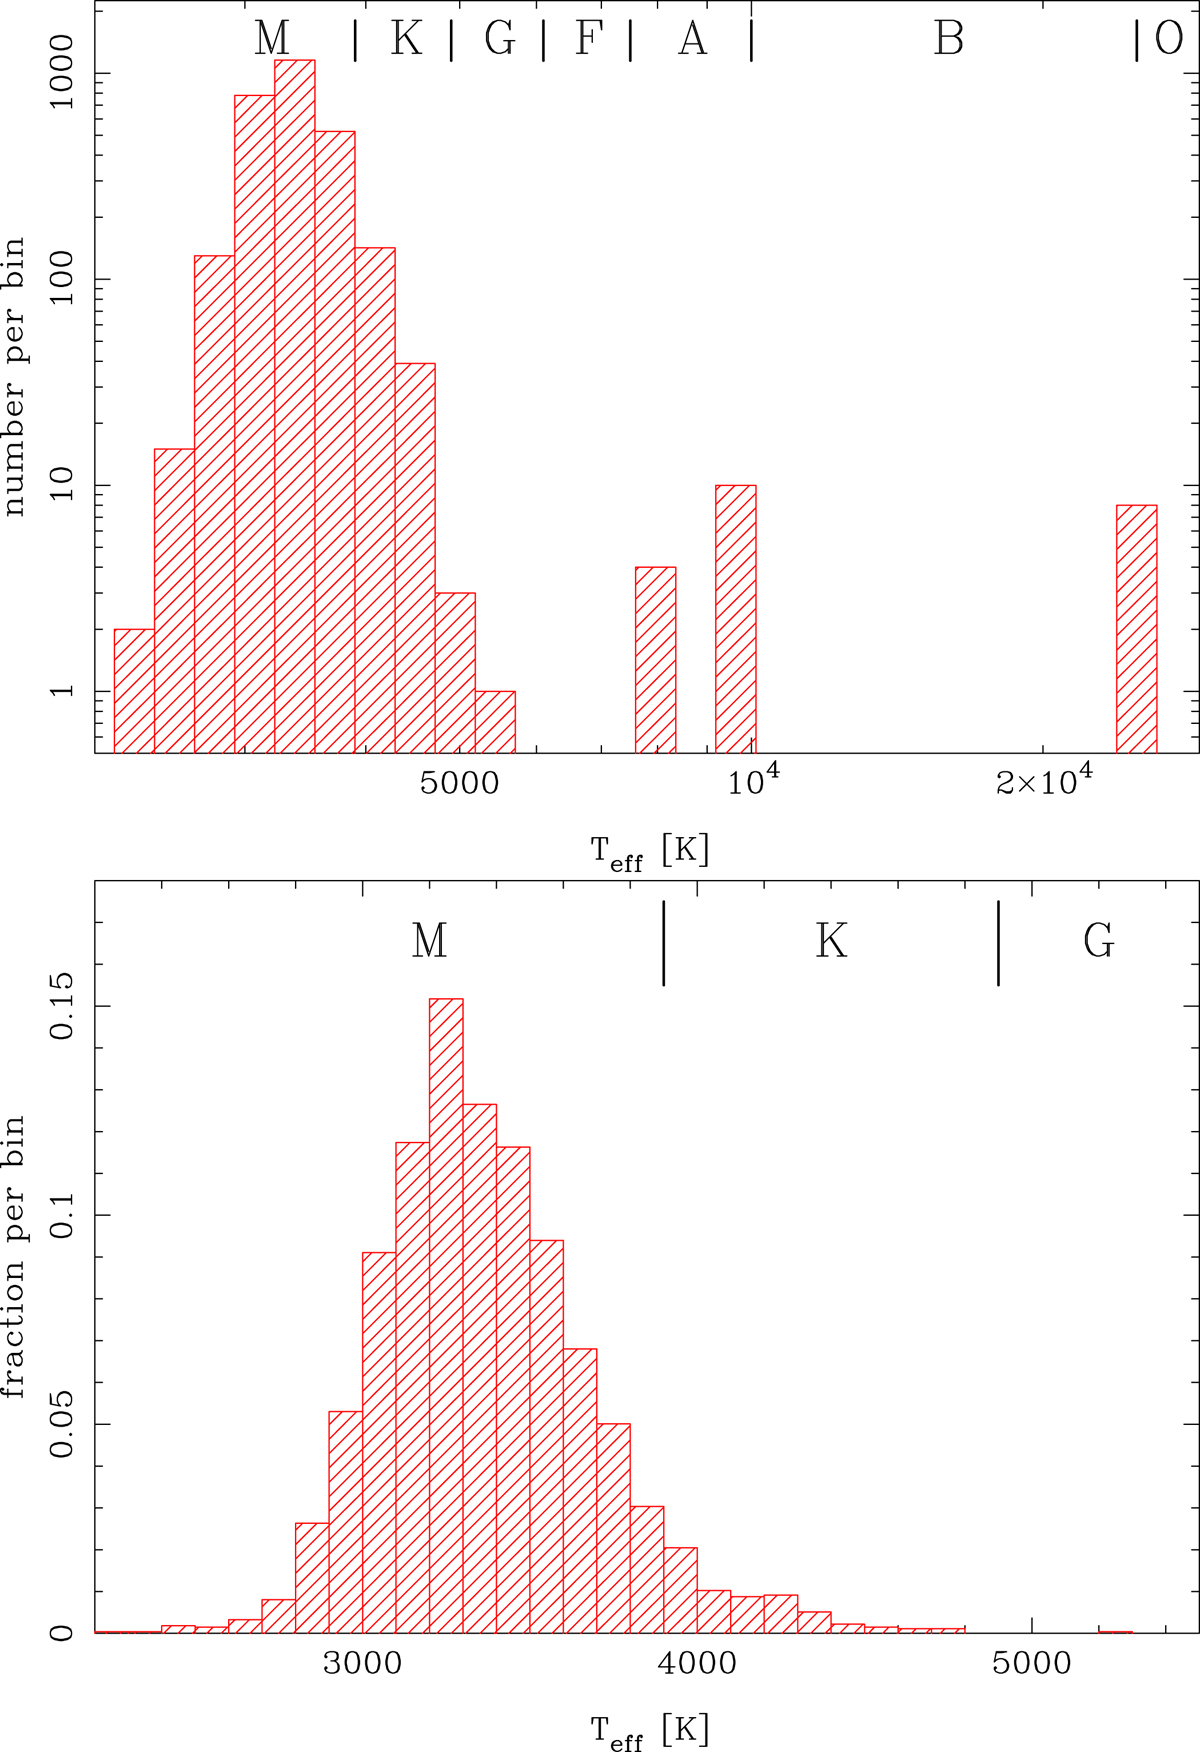
Temperature distribution of survey stars. The spectral class (borders) are indicated in the top of the plots. Top panel: all stars with S/N > 20, that is, all stars that were classifiable (with a single exception). The latter is grouped together with the young stellar objects at 8000 K. This temperature and that of the hotter stars is qualitative based on spectral feature existence. Bottom panel: zoom-in of the colder stars (stars with CO absorption) with S/N > 30, for which temperatures from line indices are calculated.
Current usage metrics show cumulative count of Article Views (full-text article views including HTML views, PDF and ePub downloads, according to the available data) and Abstracts Views on Vision4Press platform.
Data correspond to usage on the plateform after 2015. The current usage metrics is available 48-96 hours after online publication and is updated daily on week days.
Initial download of the metrics may take a while.