Fig. 1.
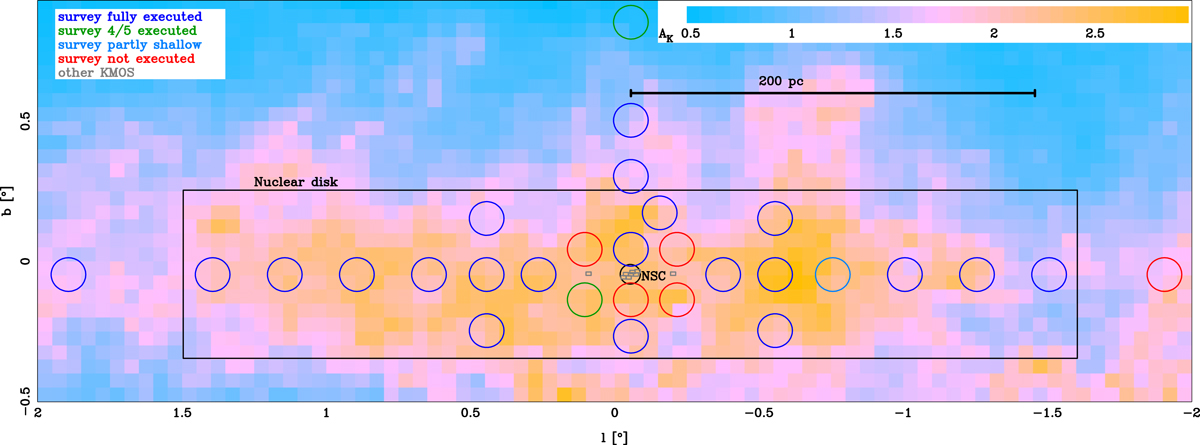
Locations of the KMOS patrol fields of our survey. As shown by the colors, most were executed. Similar KMOS observations outside of this survey are also shown (Feldmeier-Krause et al. 2020, and in prep.). Together the full nuclear disk (Launhardt et al. 2002) is covered. The small black circle in the center shows the effective radius of the nuclear cluster (Gallego-Cano et al. 2020). The background shows a low-resolution extinction map in which the average extinction varies between AK = 0.45 and 2.93; see color bar. We made the extinction map from the catalog of Nishiyama et al. (2013).
Current usage metrics show cumulative count of Article Views (full-text article views including HTML views, PDF and ePub downloads, according to the available data) and Abstracts Views on Vision4Press platform.
Data correspond to usage on the plateform after 2015. The current usage metrics is available 48-96 hours after online publication and is updated daily on week days.
Initial download of the metrics may take a while.