Free Access
Fig. C.3.
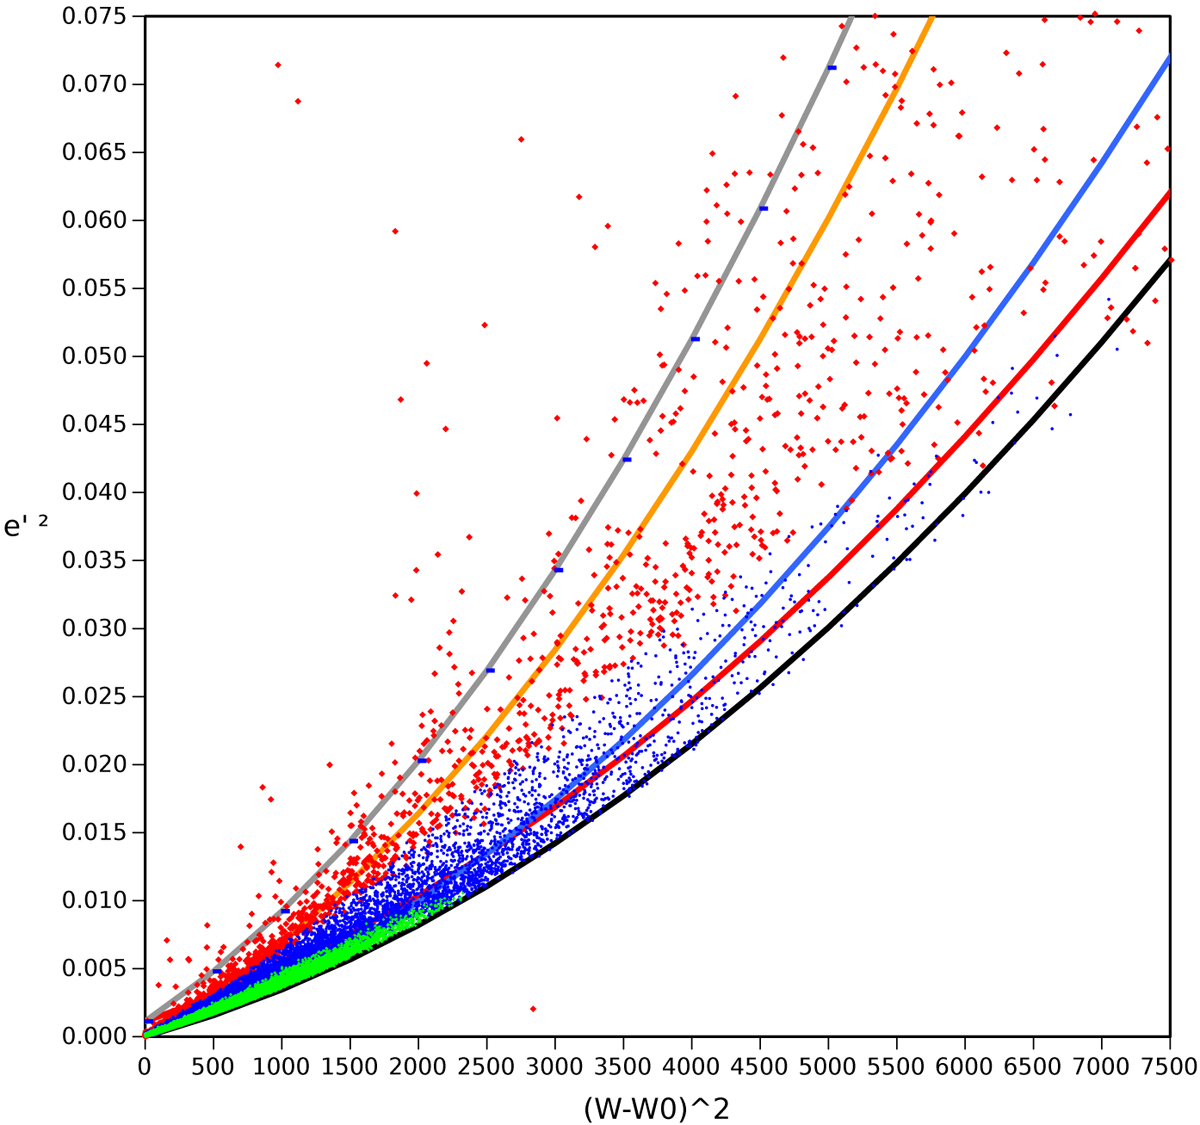
Maximum vertical velocity at r0 (black), the errors for the determination of the GP and the maximum height (red), an estimation of 20% relative error in the velocity (blue), an estimation of 50% relative variation around the radius r0 (orange), and the sum of all the errors (grey).
Current usage metrics show cumulative count of Article Views (full-text article views including HTML views, PDF and ePub downloads, according to the available data) and Abstracts Views on Vision4Press platform.
Data correspond to usage on the plateform after 2015. The current usage metrics is available 48-96 hours after online publication and is updated daily on week days.
Initial download of the metrics may take a while.