Fig. 12.
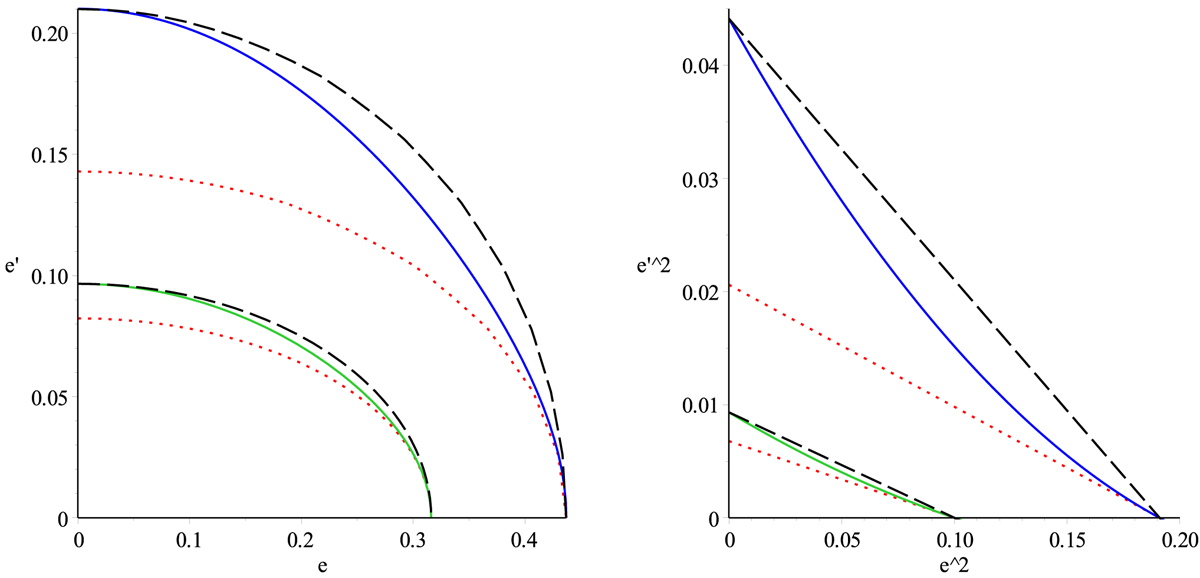
Quarter ellipses (left) define the regions up to R2 (green line) and up to R4 (blue line) according to the biquadratic approximation: Eq. (21). The red dotted lines are for the linear model, Eq. (18). The black dashed lines are approximation of the biquadratic model by an ellipse, Eq. (23). Right: corresponding regions in terms of the squared eccentricities.
Current usage metrics show cumulative count of Article Views (full-text article views including HTML views, PDF and ePub downloads, according to the available data) and Abstracts Views on Vision4Press platform.
Data correspond to usage on the plateform after 2015. The current usage metrics is available 48-96 hours after online publication and is updated daily on week days.
Initial download of the metrics may take a while.