Free Access
Fig. 2.
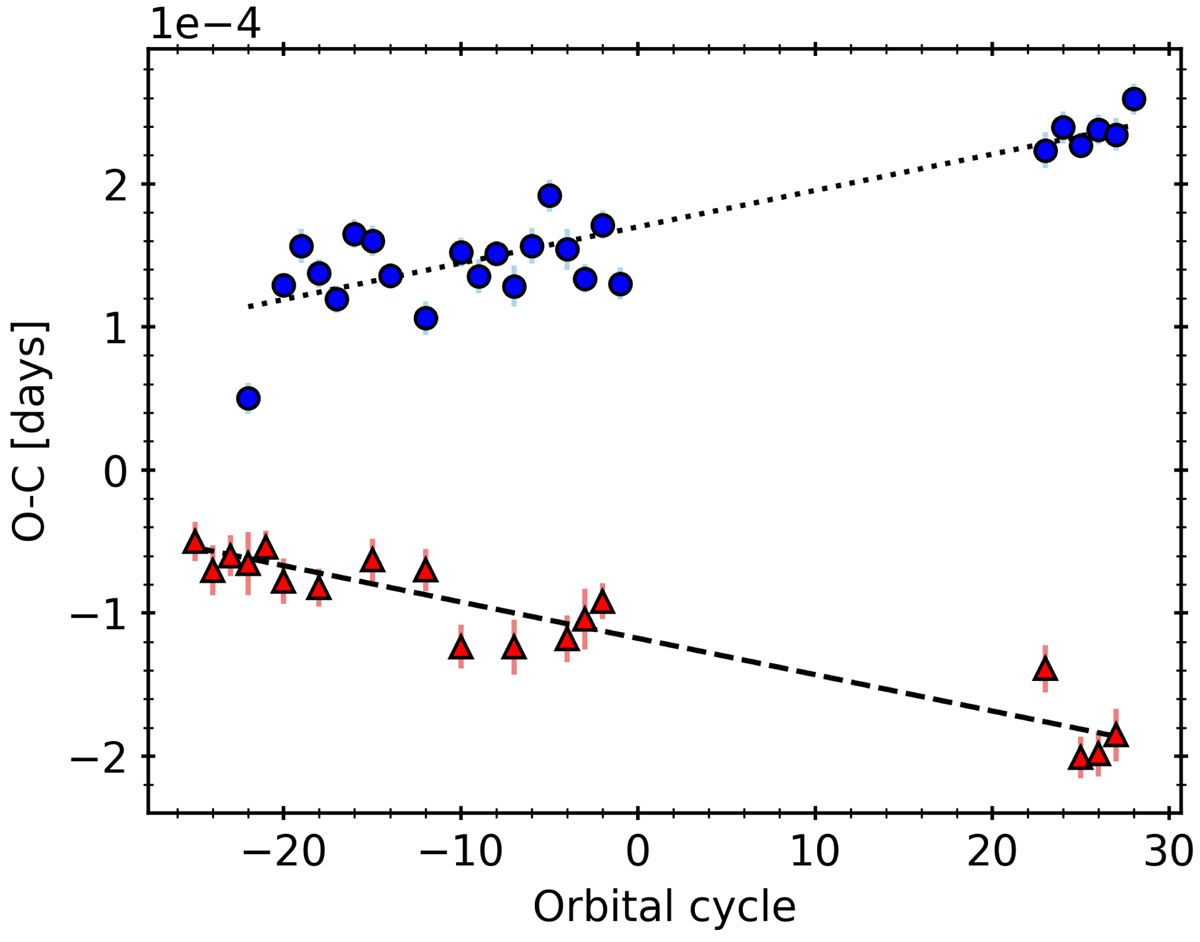
Ephemeris curve for AL Dor as a function of the orbital cycle. The dotted and dashed lines represent fits to the primary (blue circles) and secondary (red triangles) eclipses, respectively. For a better visualisation, an arbitrary shift to the primary and secondary minima has been applied.
Current usage metrics show cumulative count of Article Views (full-text article views including HTML views, PDF and ePub downloads, according to the available data) and Abstracts Views on Vision4Press platform.
Data correspond to usage on the plateform after 2015. The current usage metrics is available 48-96 hours after online publication and is updated daily on week days.
Initial download of the metrics may take a while.