Fig. 10.
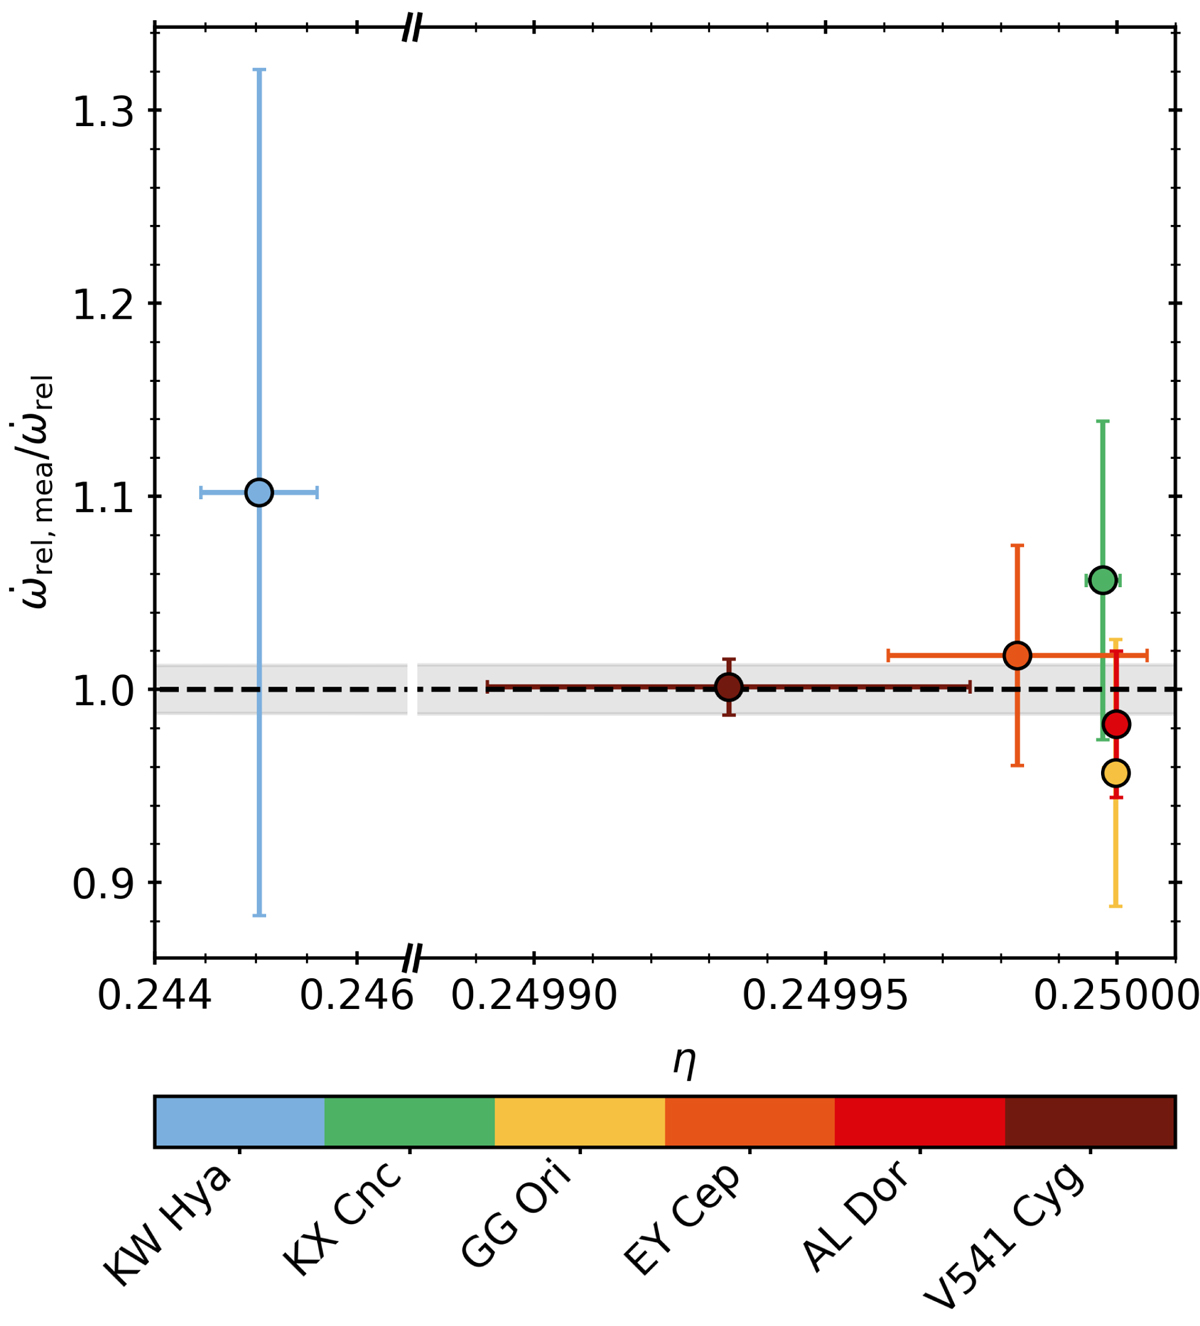
Ratio of measured and predicted GR apsidal motion rates as a function of the dimensionless reduced mass η. The black dashed line and grey shadow area correspond to the best fit of Eq. (8), assuming γ = β = 1, and its 1-σ uncertainty. We highlight the broken x-axis and the different scales. The colour code is chosen such that redder colours correspond to systems with the smaller relative error, and therefore are dominating the fit.
Current usage metrics show cumulative count of Article Views (full-text article views including HTML views, PDF and ePub downloads, according to the available data) and Abstracts Views on Vision4Press platform.
Data correspond to usage on the plateform after 2015. The current usage metrics is available 48-96 hours after online publication and is updated daily on week days.
Initial download of the metrics may take a while.