Free Access
Fig. 7
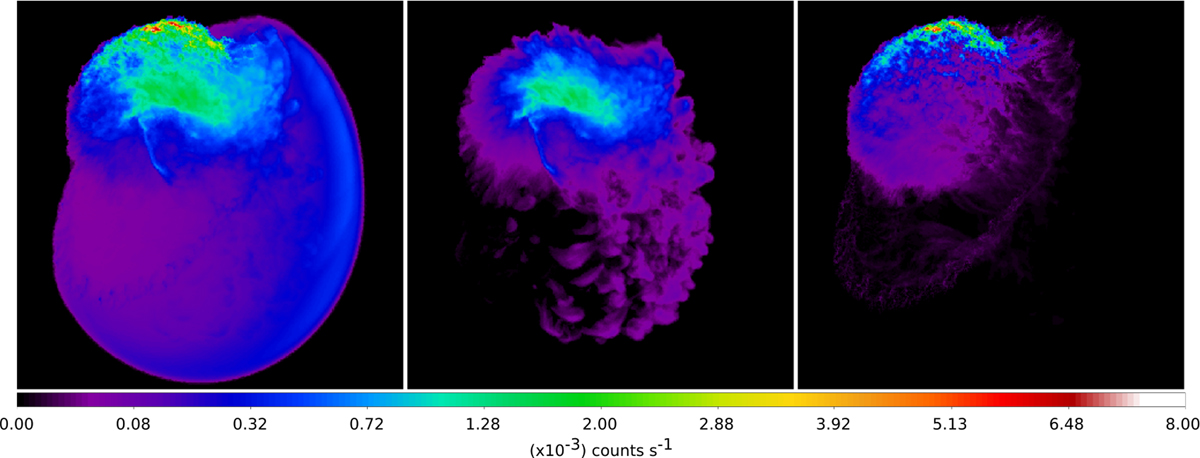
Synthetic X-ray count rate maps in the [0.5−1.4] keV band (in square root scale) at t ≈ 8400 yr, derived from the best model, as explained in Sect. 2.2 for the different components of the plasma: the whole distribution (left panel), solely the ejecta (middle panel), and the atomic and molecular clouds (right panel).
Current usage metrics show cumulative count of Article Views (full-text article views including HTML views, PDF and ePub downloads, according to the available data) and Abstracts Views on Vision4Press platform.
Data correspond to usage on the plateform after 2015. The current usage metrics is available 48-96 hours after online publication and is updated daily on week days.
Initial download of the metrics may take a while.