Fig. 3
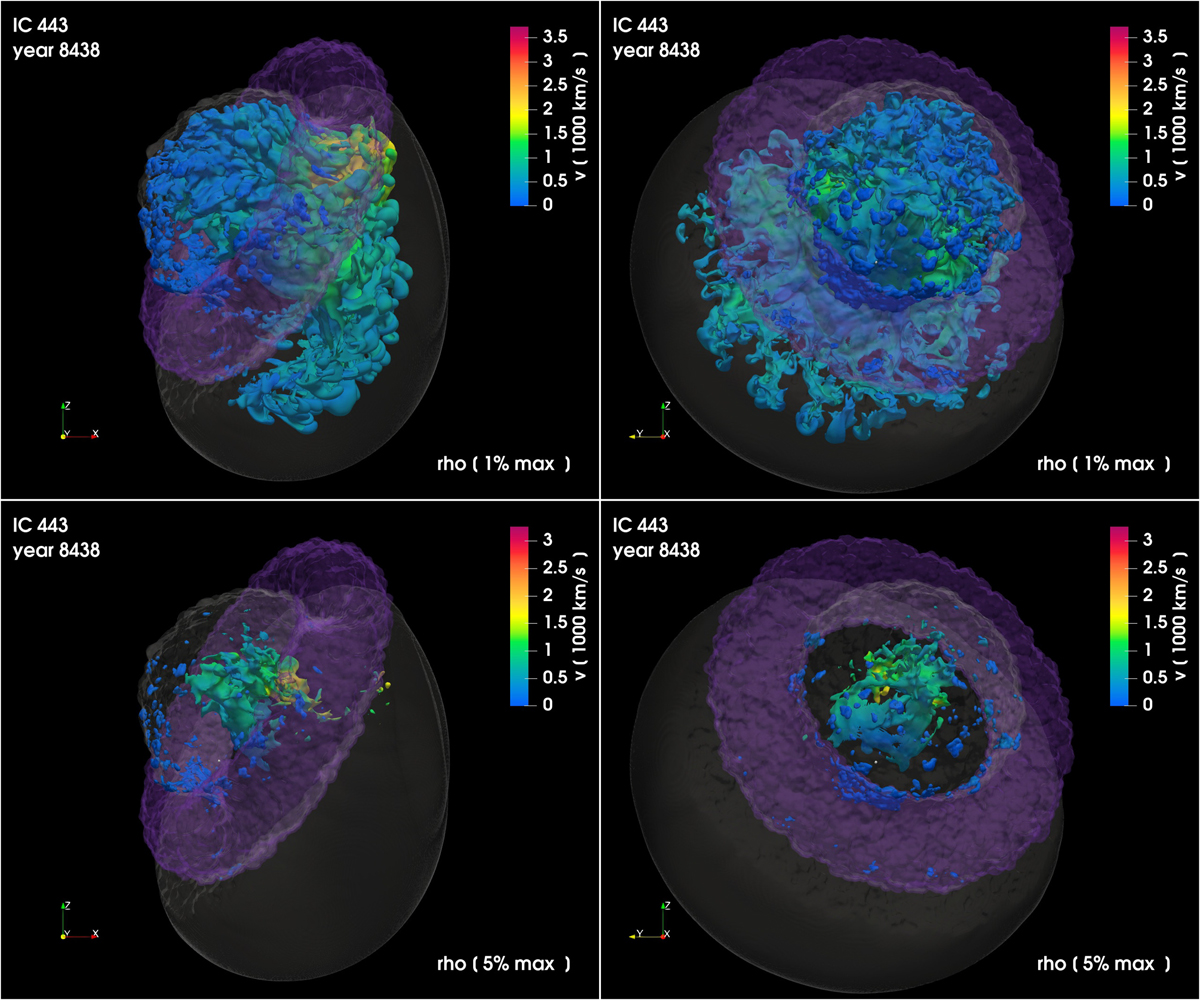
Isosurfaces of the distribution of density at t ≈ 8400 yr for the ejecta of the favorite model for SNR IC 443 for different viewing angles: along the LoS (left panels), and rotated by 90° about the z-axis of the image (right panels). The opaque irregular isosurfaces correspond to a value of density that is at 1% (upper panels) and 5% (lower panels) of the peak density; their colors give the radial velocity in units of 1000 km s−1 on the isosurface. The semi-transparent surface marks the position of the forward shock; the toroidal semi-transparent structure in purple represents the molecular cloud. See online Movie 2 and Movie 3 for an animation of these data; a navigable 3D graphic is available at https://skfb.ly/6W9oM.
Current usage metrics show cumulative count of Article Views (full-text article views including HTML views, PDF and ePub downloads, according to the available data) and Abstracts Views on Vision4Press platform.
Data correspond to usage on the plateform after 2015. The current usage metrics is available 48-96 hours after online publication and is updated daily on week days.
Initial download of the metrics may take a while.