Fig. 2
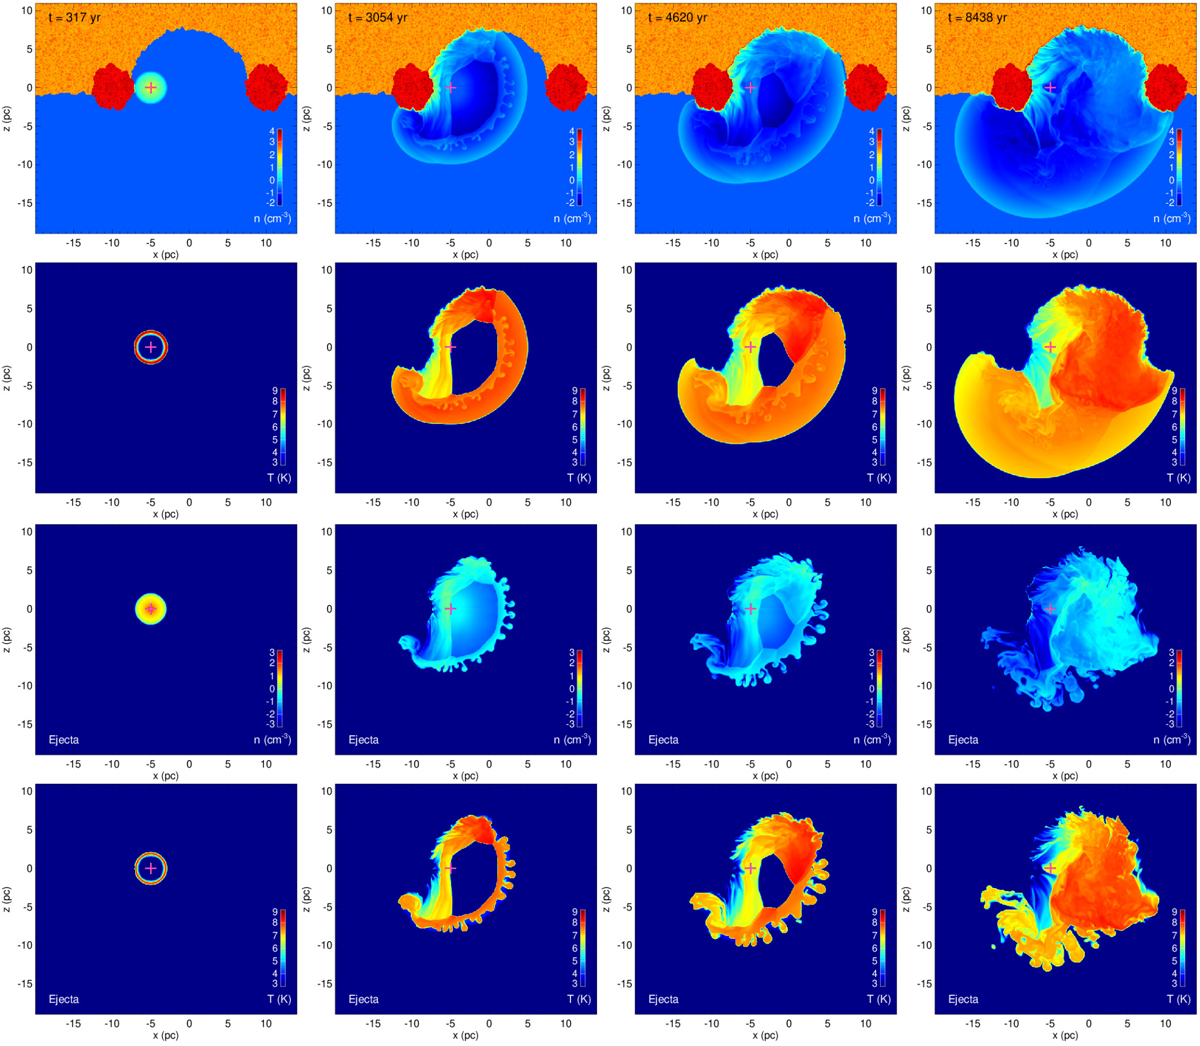
Density (first row; third row, only the ejecta) and ionic temperature (second row; fourth row, only the ejecta) distributions in logarithmic scale in the (x, 0, z) plane at different evolution times (increasing from left to right). The magenta cross indicates the position of the explosion. See online Movie 1 for the complete temporal evolution.
Current usage metrics show cumulative count of Article Views (full-text article views including HTML views, PDF and ePub downloads, according to the available data) and Abstracts Views on Vision4Press platform.
Data correspond to usage on the plateform after 2015. The current usage metrics is available 48-96 hours after online publication and is updated daily on week days.
Initial download of the metrics may take a while.