Fig. 9.
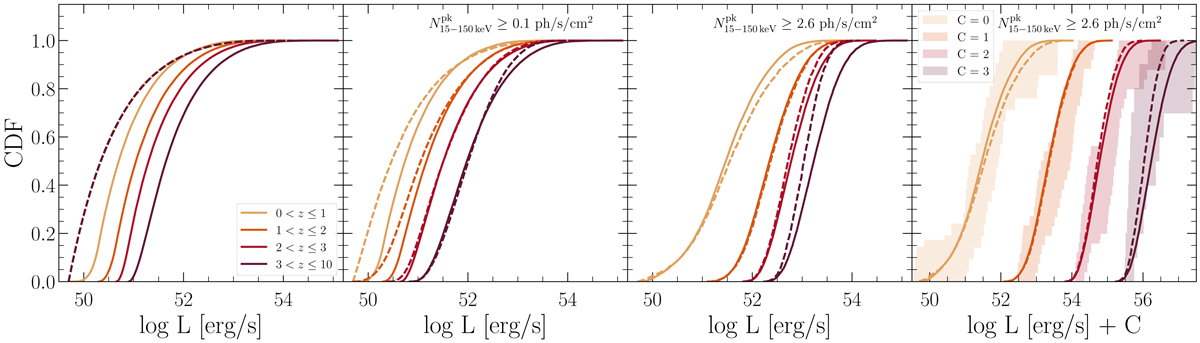
Luminosity cumulative distribution function in four different redshift bins for the intrinsic Ep − L correlation scenario. The full lines correspond to kevol = 2 and the dashed lines to kevol = 0. Leftmost panel: entire intrinsic LGRB population, centre left and centre right panels: bursts with ![]() and 2.6 ph s−1 cm−2 respectively. Rightmost panel: same as the centre right panel but adding the observed eBAT6 sample and where each curve was shifted by a constant C for clarity. The shaded area represents the 95% confidence region for the CDF of the observed eBAT6 sample, calculated using bootstrapping (without taking into account limits).
and 2.6 ph s−1 cm−2 respectively. Rightmost panel: same as the centre right panel but adding the observed eBAT6 sample and where each curve was shifted by a constant C for clarity. The shaded area represents the 95% confidence region for the CDF of the observed eBAT6 sample, calculated using bootstrapping (without taking into account limits).
Current usage metrics show cumulative count of Article Views (full-text article views including HTML views, PDF and ePub downloads, according to the available data) and Abstracts Views on Vision4Press platform.
Data correspond to usage on the plateform after 2015. The current usage metrics is available 48-96 hours after online publication and is updated daily on week days.
Initial download of the metrics may take a while.