Fig. 7.
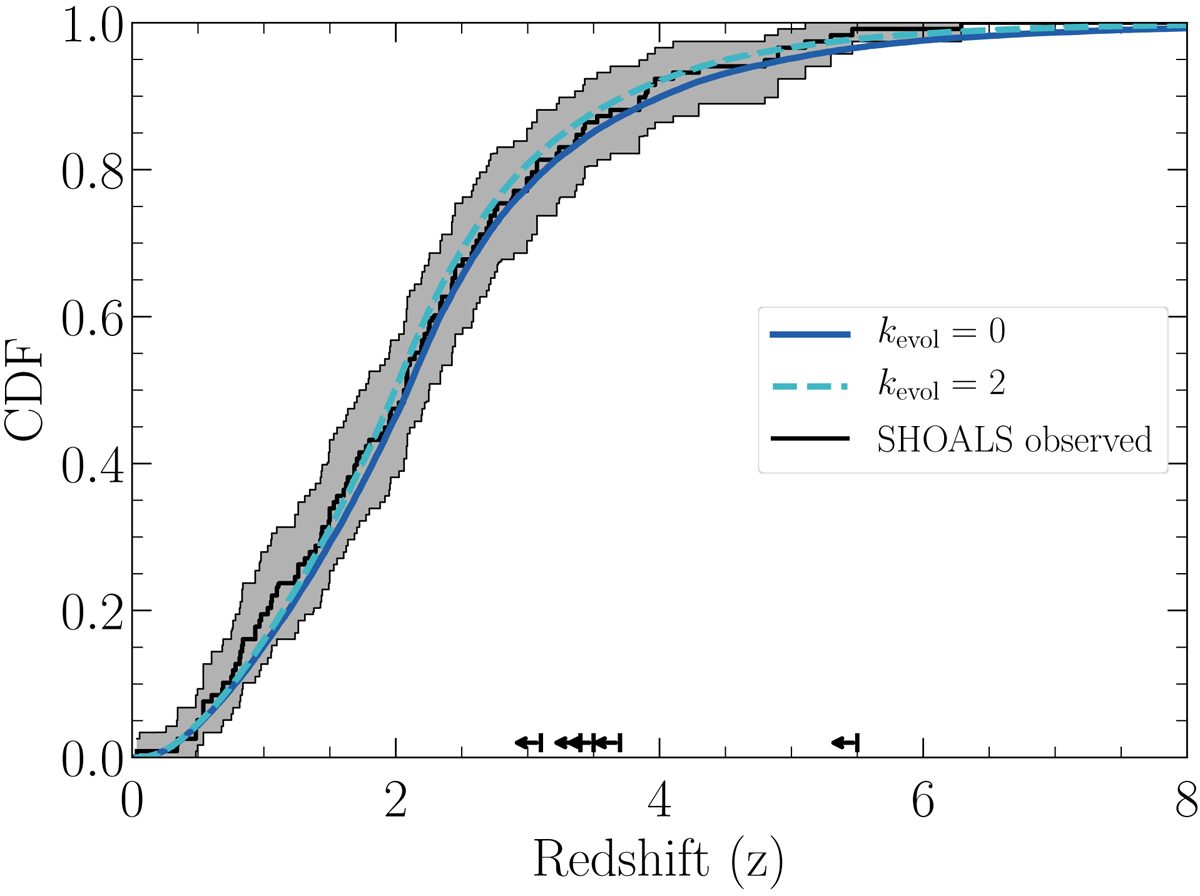
Cumulative redshift distribution of the observed SHOALS sample in black; the 95% confidence bound calculated from bootstrapping is shown in grey and the upper limits are shown as arrows at the bottom of the plot. The predictions for the intrinsic Ep − L correlation scenarios with kevol = 0 and kevol = 2 are shown in blue and dashed light blue, respectively.
Current usage metrics show cumulative count of Article Views (full-text article views including HTML views, PDF and ePub downloads, according to the available data) and Abstracts Views on Vision4Press platform.
Data correspond to usage on the plateform after 2015. The current usage metrics is available 48-96 hours after online publication and is updated daily on week days.
Initial download of the metrics may take a while.