Fig. 6.
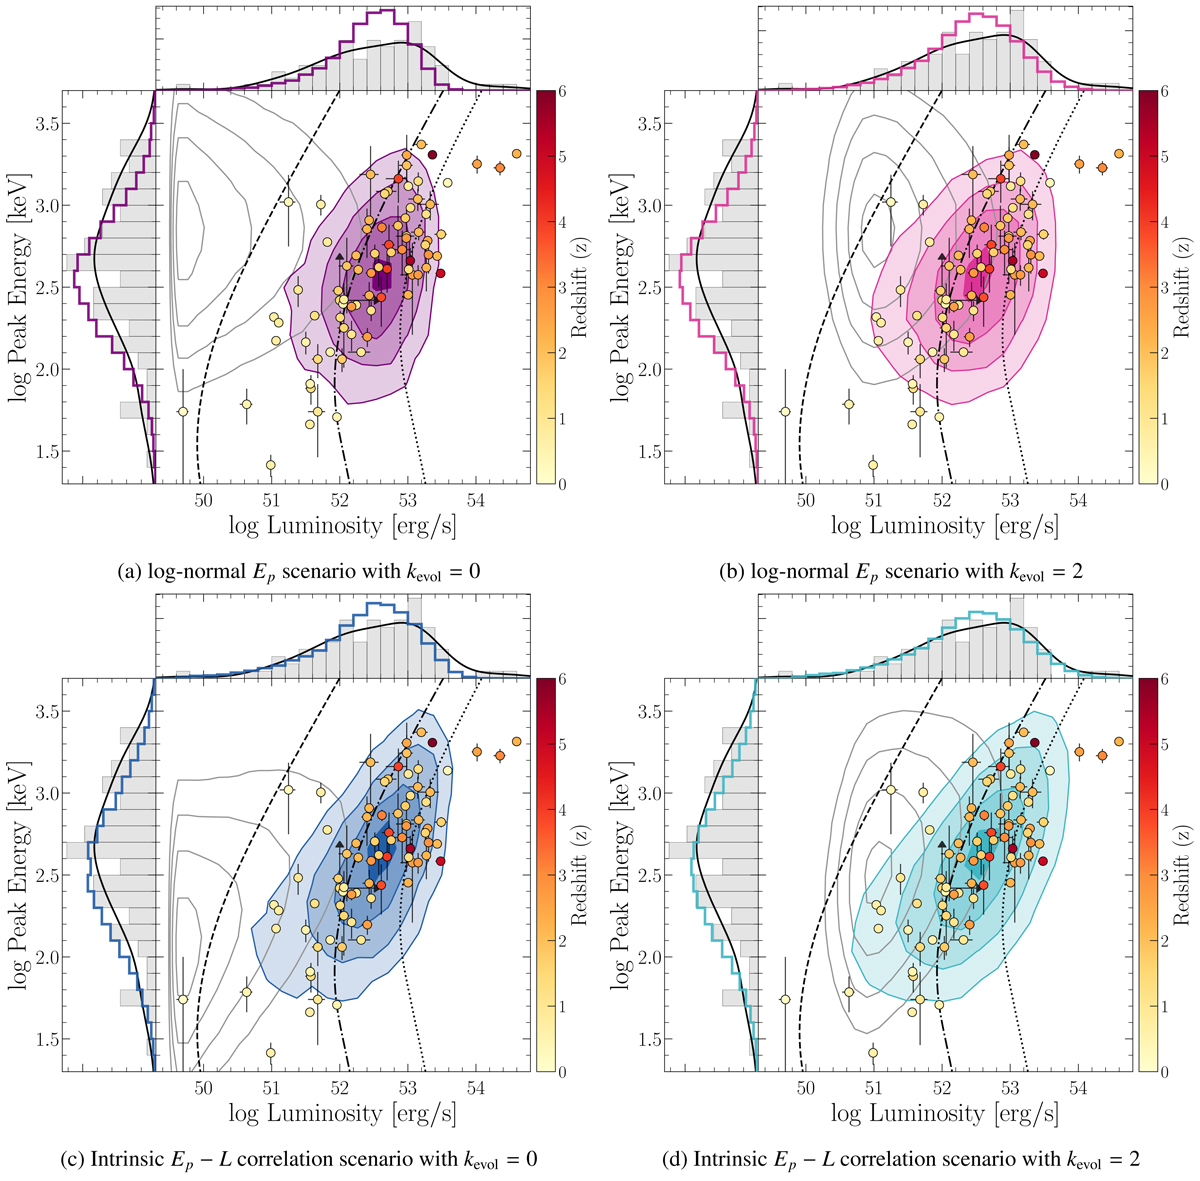
Swift/eBAT6 Ep − L plane for models with no redshift evolution of the luminosity function (a, c) and with strong redshift evolution of the luminosity function (b, d). Top panels (a, b): independent log-normal Ep scenarios; bottom panels (c, d): intrinsic Ep − L correlation scenarios. The predictions for the entire intrinsic LGRB population is shown as grey contours and the predictions for the mock eBAT6 sample are shown in coloured filled contours. The observed eBAT6 sample is shown as coloured scatter points, the 2D Gaussian kernel density estimation shown in Fig. 4 is omitted for clarity. A full description of the observed data points, the side histograms and the dashed, dot-dashed and dotted curves of the figure is presented in Fig. 4.
Current usage metrics show cumulative count of Article Views (full-text article views including HTML views, PDF and ePub downloads, according to the available data) and Abstracts Views on Vision4Press platform.
Data correspond to usage on the plateform after 2015. The current usage metrics is available 48-96 hours after online publication and is updated daily on week days.
Initial download of the metrics may take a while.