Fig. 3.
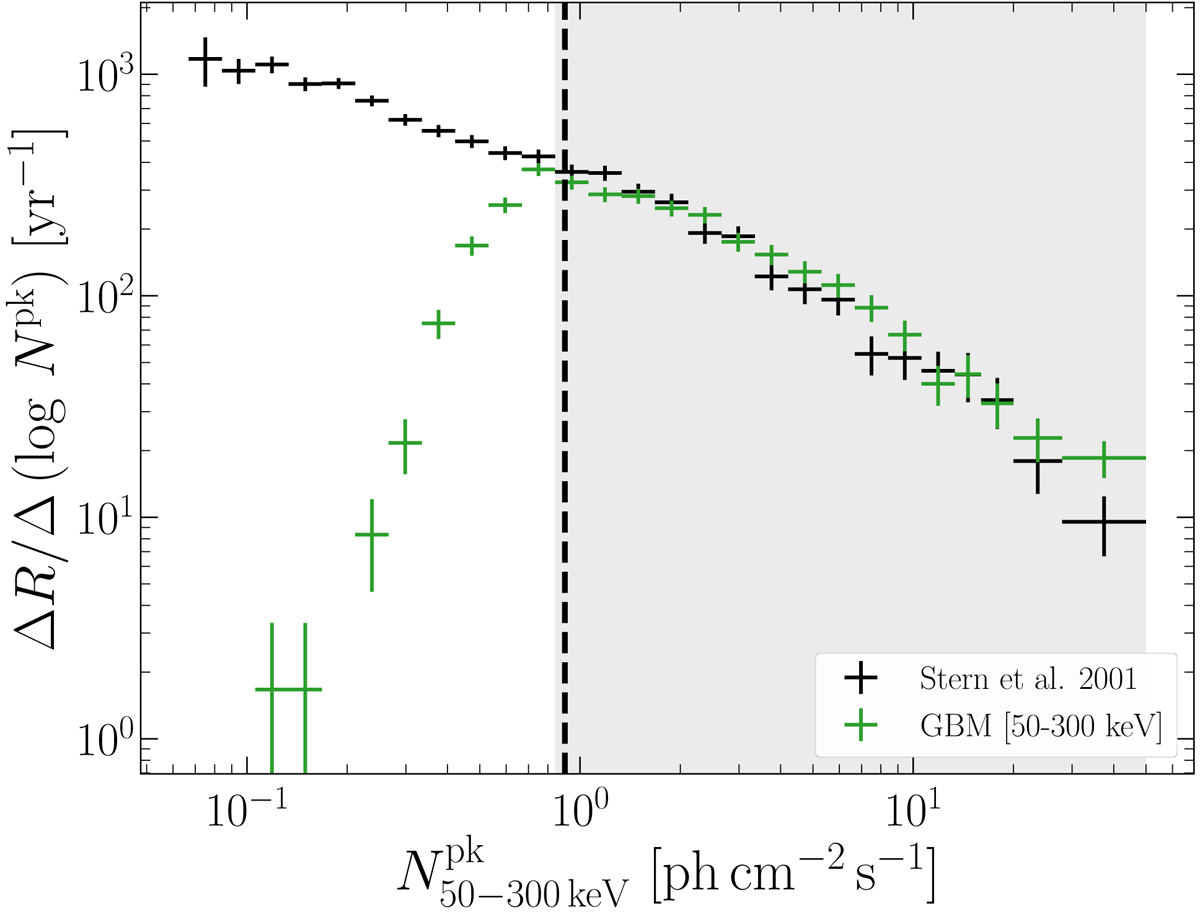
Efficiency-corrected log N − log P diagram for CGRO/BATSE from Stern et al. (2001) in black. The log N − log P of GBM is shown in green, adjusted to the one of CGRO/BATSE by multiplying by a constant whose value is obtained by minimising the χ2 between the two histograms over the grey shaded region. The black dashed vertical line represents the Npk cut to avoid biases due to faint flux incompleteness for our spectral constraint.
Current usage metrics show cumulative count of Article Views (full-text article views including HTML views, PDF and ePub downloads, according to the available data) and Abstracts Views on Vision4Press platform.
Data correspond to usage on the plateform after 2015. The current usage metrics is available 48-96 hours after online publication and is updated daily on week days.
Initial download of the metrics may take a while.