Fig. D.1.
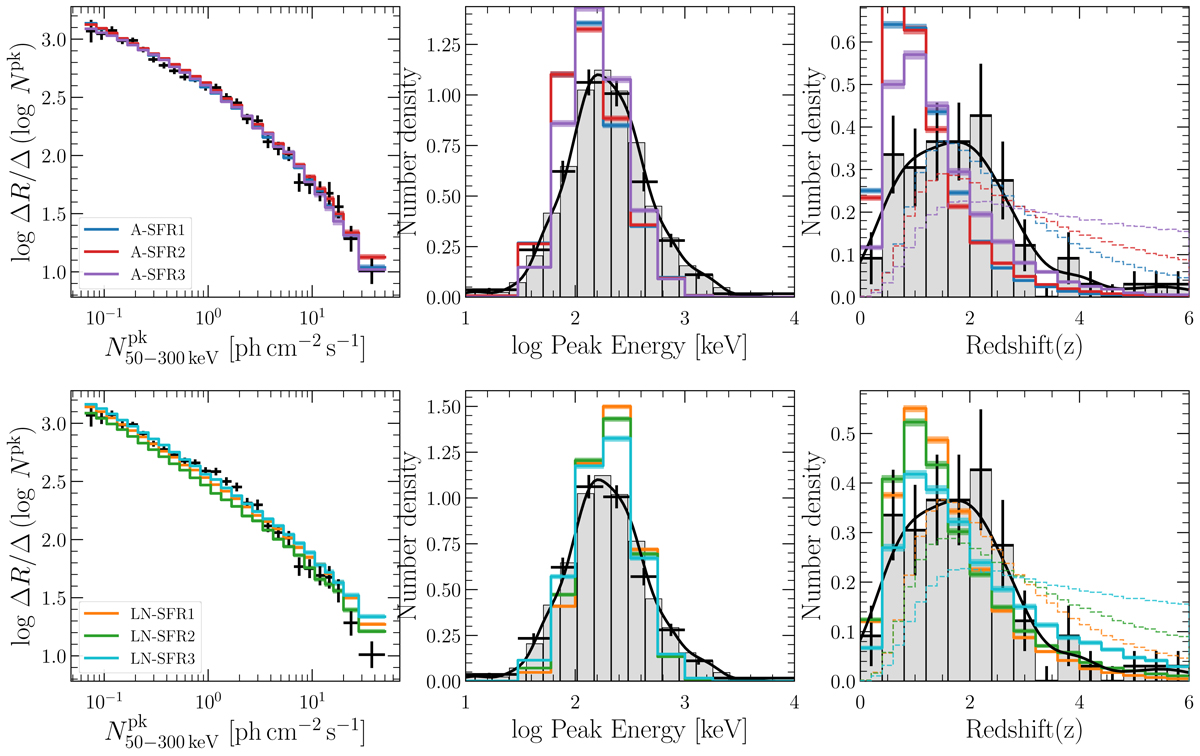
Population generated using the model parameters of Daigne et al. (2006) compared to the observational constraints presented in Sect. 3. In the rightmost panels, the dashed lines correspond to the redshift distribution of the entire intrinsic population. Top panels: intrinsic Ep − L correlation scenarios and bottom panels: independent log-normal Ep scenarios.
Current usage metrics show cumulative count of Article Views (full-text article views including HTML views, PDF and ePub downloads, according to the available data) and Abstracts Views on Vision4Press platform.
Data correspond to usage on the plateform after 2015. The current usage metrics is available 48-96 hours after online publication and is updated daily on week days.
Initial download of the metrics may take a while.