Fig. C.1.
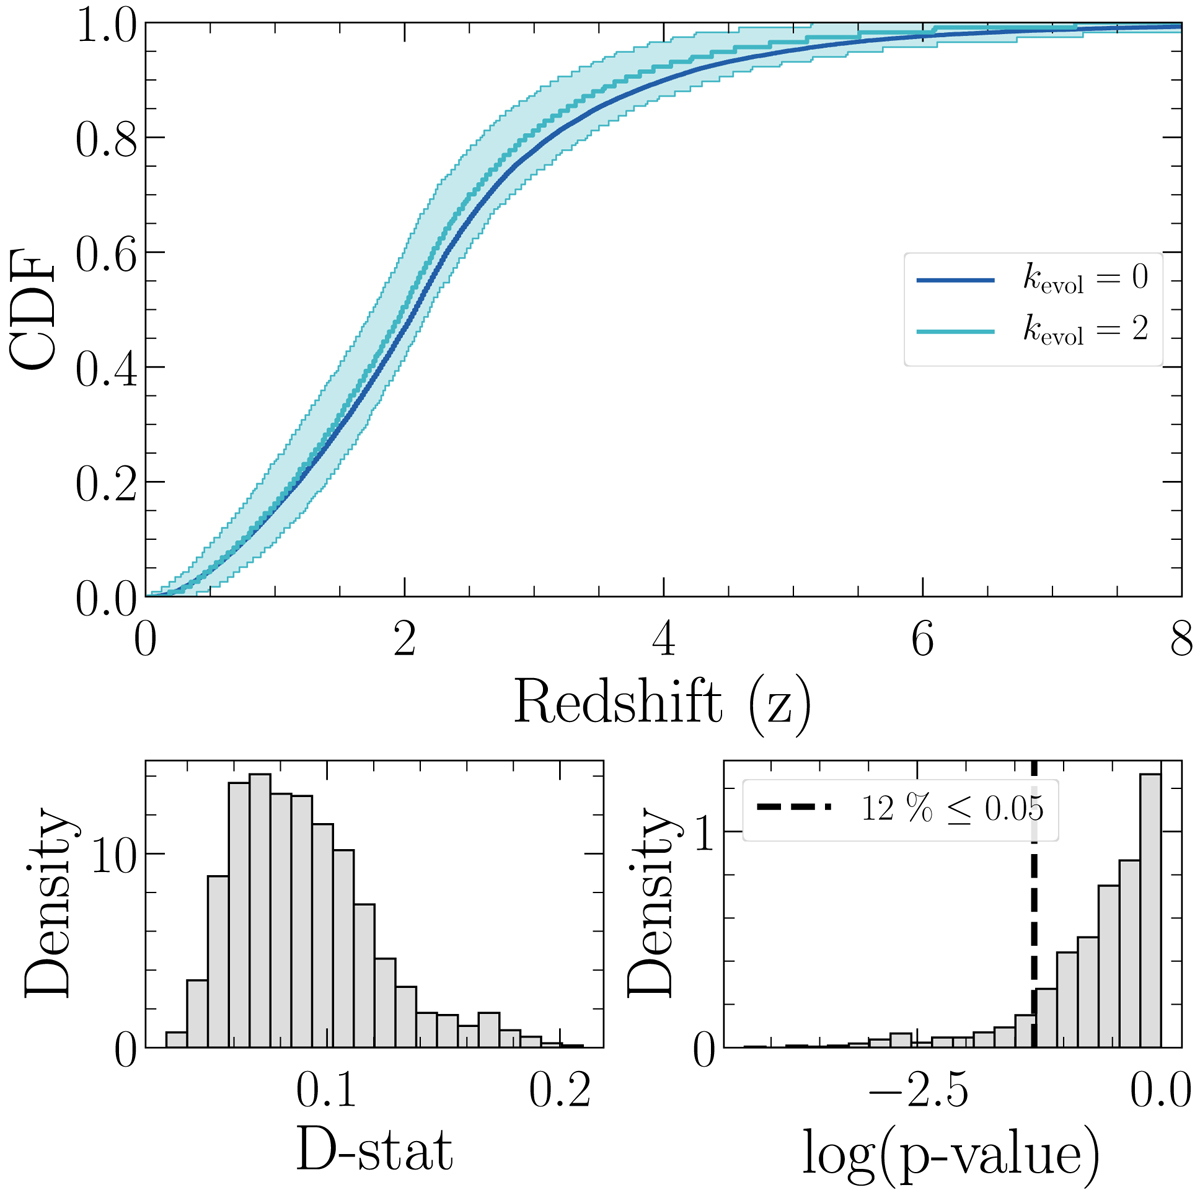
Test to distinguish between the two extreme scenarios in terms of cosmic evolution of the luminosity function. Top panel: redshift cumulative distribution function of the intrinsic Ep − L correlation scenarios cut at ℱcut = 10−6 ph cm−2 for kevol = 0 in dark blue and kevol = 2 in light blue. The kevol = 2 scenario is sub-sampled at Nsub = 117; the 95% confidence bound is calculated from bootstrapping. Bottom panel: distribution of p-values (right) and D-statistics (left) from the K–S tests performed on the bootstrapped samples. The back dashed vertical line shows a p-value of 0.05, below which it is possible to distinguish between the two distributions at the 95% confidence level.
Current usage metrics show cumulative count of Article Views (full-text article views including HTML views, PDF and ePub downloads, according to the available data) and Abstracts Views on Vision4Press platform.
Data correspond to usage on the plateform after 2015. The current usage metrics is available 48-96 hours after online publication and is updated daily on week days.
Initial download of the metrics may take a while.