Fig. A.1.
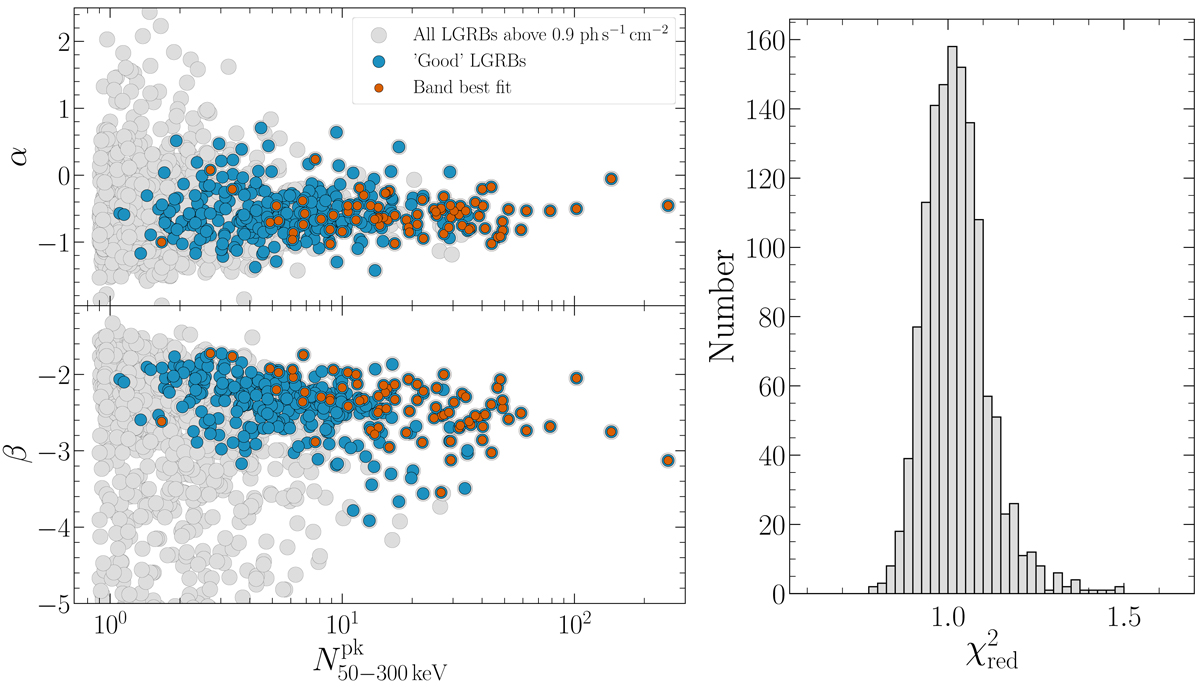
Quality of Band fits to GRB spectra from GBM catalogue (Bhat et al. 2016). Left: spectral slopes α (top) and β (bottom) as a function of peak flux for the GBM spectral catalogue (Bhat et al. 2016). The entire catalogue of long GRBs above 0.9 ph s−1 cm−2 is in light-grey, the bursts complying with the ‘good’ criteria (i.e., small errors on the parameters) are shown in blue, the bursts for which Band is the best-fit spectral model are shown in orange. Right: reduced χ2 distribution for Band models from the GBM spectral catalogue (Bhat et al. 2016).
Current usage metrics show cumulative count of Article Views (full-text article views including HTML views, PDF and ePub downloads, according to the available data) and Abstracts Views on Vision4Press platform.
Data correspond to usage on the plateform after 2015. The current usage metrics is available 48-96 hours after online publication and is updated daily on week days.
Initial download of the metrics may take a while.