Fig. 11.
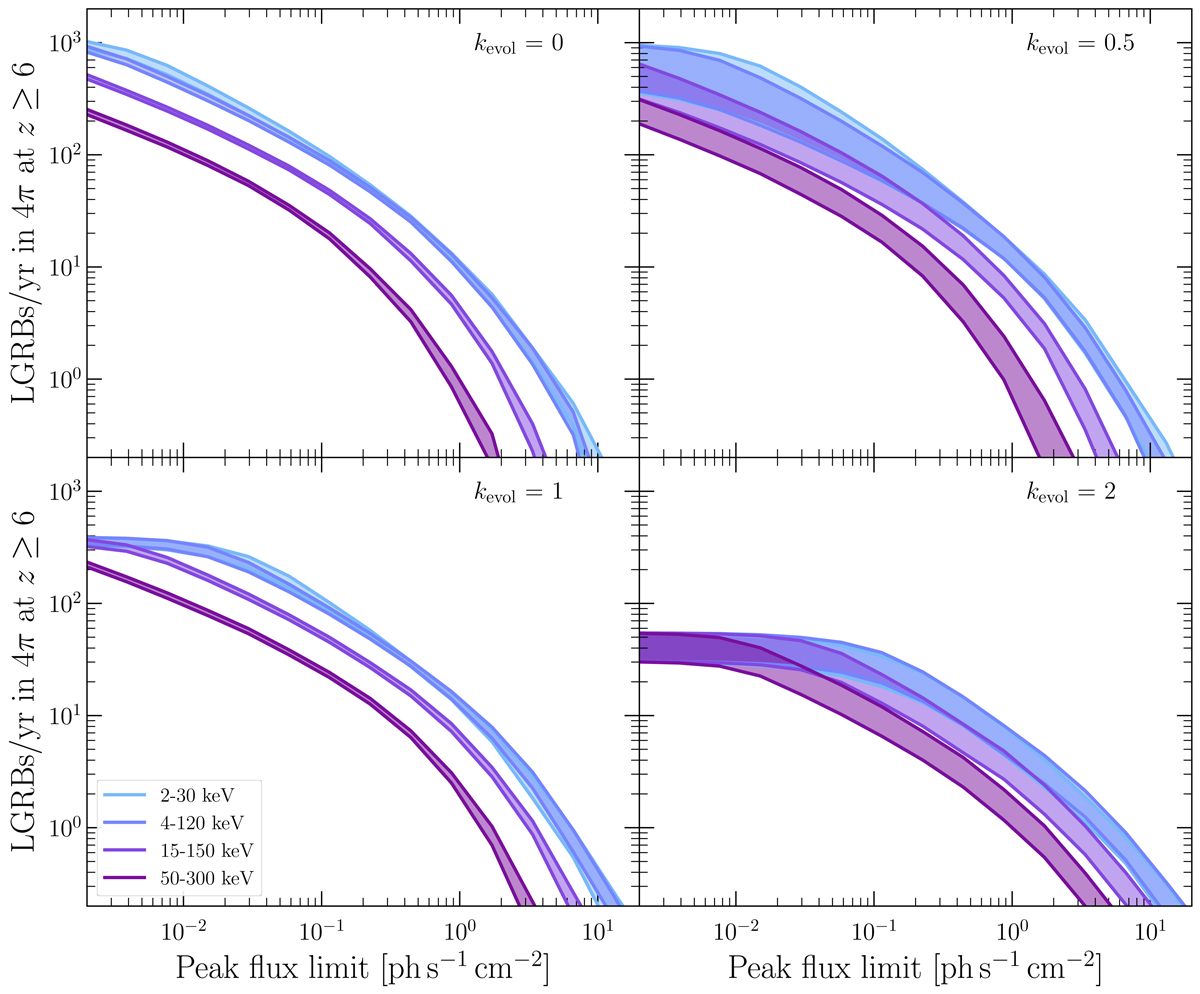
All-sky rate of LGRBs at z ≥ 6, as a function of limiting peak flux for different energy bands in the intrinsic Ep − L correlation scenario. Each panel corresponds to a luminosity evolution scenario (from no evolution at kevol = 0 to strong evolution at kevol = 2). To obtain the actual observed rate for a given mission, one should take into account the field of view of the instrument and its duty cycle. The shaded area represents the 95% confidence interval.
Current usage metrics show cumulative count of Article Views (full-text article views including HTML views, PDF and ePub downloads, according to the available data) and Abstracts Views on Vision4Press platform.
Data correspond to usage on the plateform after 2015. The current usage metrics is available 48-96 hours after online publication and is updated daily on week days.
Initial download of the metrics may take a while.