Fig. 1.
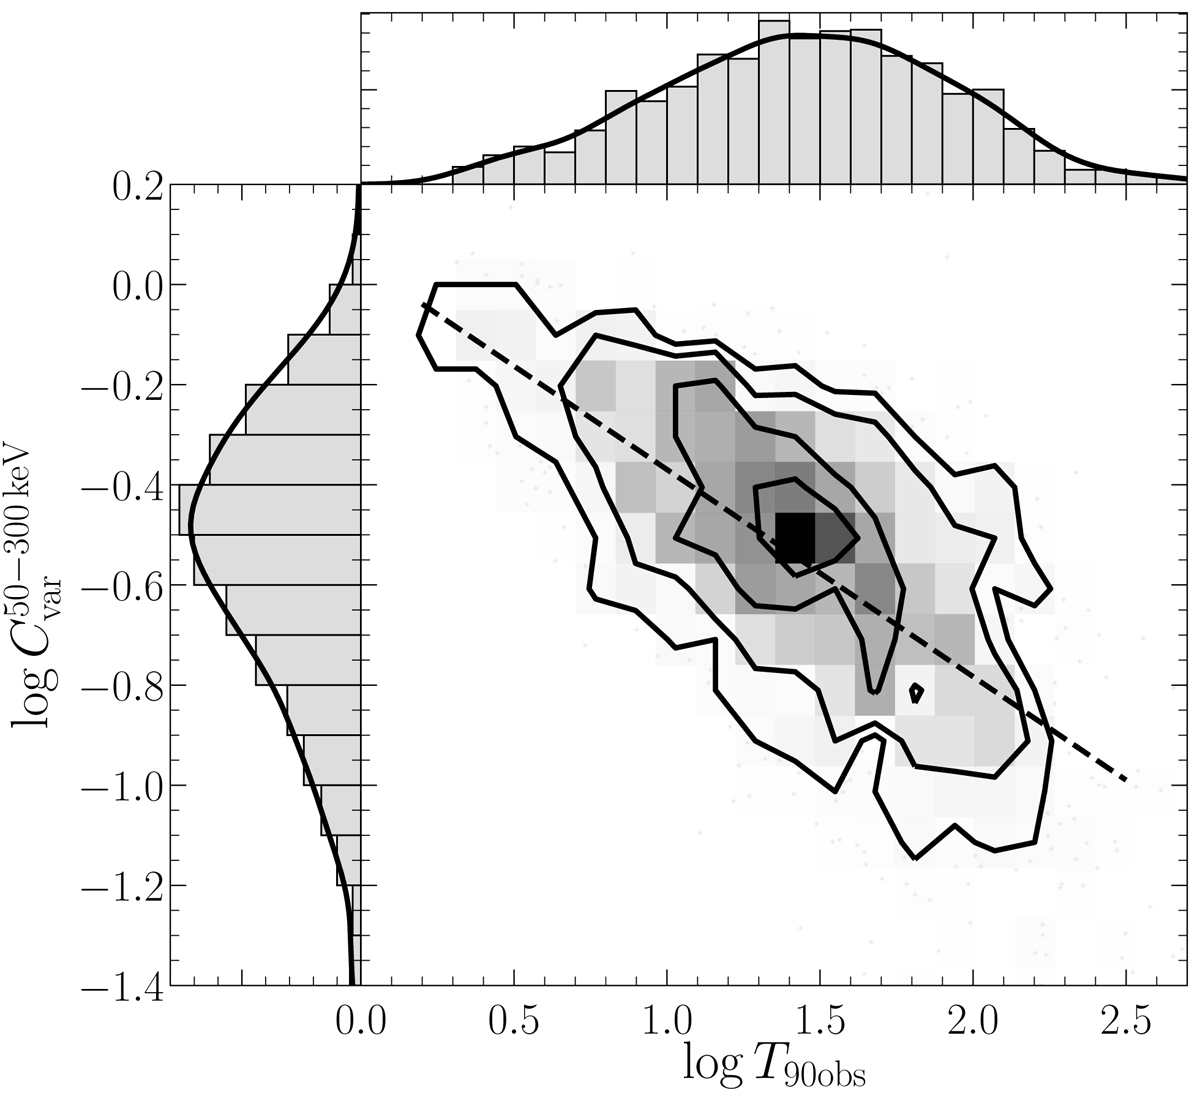
Distribution of Cvar and T90 obs for the GBM catalogue of Bhat et al. (2016) for burst with ![]() . The data are binned in a 2D histogram whose shading represents the density of points; contours are also shown to guide the eye. The black dashed line corresponds to the linear fit of Eq. (11). The black filled lines in the side histograms are the 1D Gaussian kernel density estimations of the data.
. The data are binned in a 2D histogram whose shading represents the density of points; contours are also shown to guide the eye. The black dashed line corresponds to the linear fit of Eq. (11). The black filled lines in the side histograms are the 1D Gaussian kernel density estimations of the data.
Current usage metrics show cumulative count of Article Views (full-text article views including HTML views, PDF and ePub downloads, according to the available data) and Abstracts Views on Vision4Press platform.
Data correspond to usage on the plateform after 2015. The current usage metrics is available 48-96 hours after online publication and is updated daily on week days.
Initial download of the metrics may take a while.