Fig. 2.
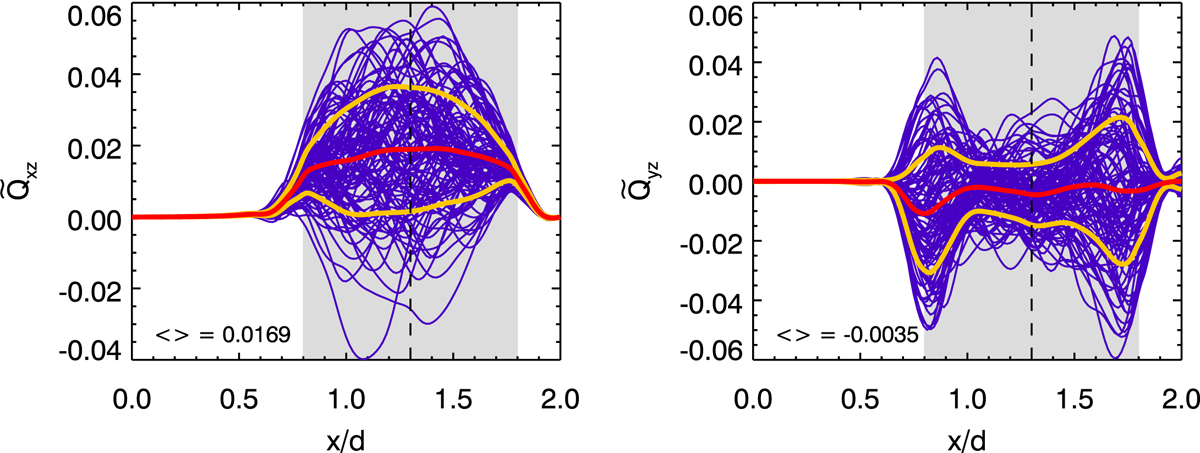
Left: vertical cross-correlation ![]() for B = (1, 0, 10) (left panel) and the horizontal cross-correlations
for B = (1, 0, 10) (left panel) and the horizontal cross-correlations ![]() for B = (0, 1, 10) (right panel). We note that
for B = (0, 1, 10) (right panel). We note that ![]() is much smaller than
is much smaller than ![]() (see Eq. (28)). Each blue line represents the horizontal average over one snapshot. The red lines represent averages over the snapshots, and the yellow lines indicate the standard deviation. The convectively unstable part of the box is grey-shaded. The numbers in ⟨⟩-brackets are the averages taken over the whole unstably stratified layer and over time; Ω = 0, Pr = 0.1, and Pm = 0.1.
(see Eq. (28)). Each blue line represents the horizontal average over one snapshot. The red lines represent averages over the snapshots, and the yellow lines indicate the standard deviation. The convectively unstable part of the box is grey-shaded. The numbers in ⟨⟩-brackets are the averages taken over the whole unstably stratified layer and over time; Ω = 0, Pr = 0.1, and Pm = 0.1.
Current usage metrics show cumulative count of Article Views (full-text article views including HTML views, PDF and ePub downloads, according to the available data) and Abstracts Views on Vision4Press platform.
Data correspond to usage on the plateform after 2015. The current usage metrics is available 48-96 hours after online publication and is updated daily on week days.
Initial download of the metrics may take a while.