Fig. 6.
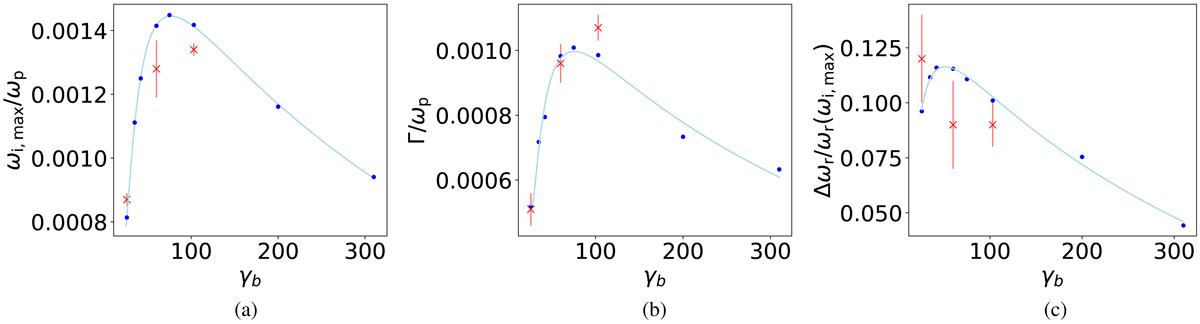
Influence of the beam velocity in the weak-beam limit n1 ≪ n0 (i.e., rn = 10−3). Panel a: maximum values of ωi for different beam velocities ![]() obtained from the solutions of the linear dispersion relation (dots) and simulations (crosses) with fit function (solid line). Panel b: integrated growth rates from numerical solutions of the dispersion relation (dots) and from simulations (crosses) with fit function (solid line). Panel c: fractional bandwidth Δωr at the point where ωi is at its maximum, normalised to the corresponding real part of frequency ωr, obtained from linear theory (dots) and simulation (crosses). All three figures for ρ0 = ρ1 = 1, rn = 10−3.
obtained from the solutions of the linear dispersion relation (dots) and simulations (crosses) with fit function (solid line). Panel b: integrated growth rates from numerical solutions of the dispersion relation (dots) and from simulations (crosses) with fit function (solid line). Panel c: fractional bandwidth Δωr at the point where ωi is at its maximum, normalised to the corresponding real part of frequency ωr, obtained from linear theory (dots) and simulation (crosses). All three figures for ρ0 = ρ1 = 1, rn = 10−3.
Current usage metrics show cumulative count of Article Views (full-text article views including HTML views, PDF and ePub downloads, according to the available data) and Abstracts Views on Vision4Press platform.
Data correspond to usage on the plateform after 2015. The current usage metrics is available 48-96 hours after online publication and is updated daily on week days.
Initial download of the metrics may take a while.