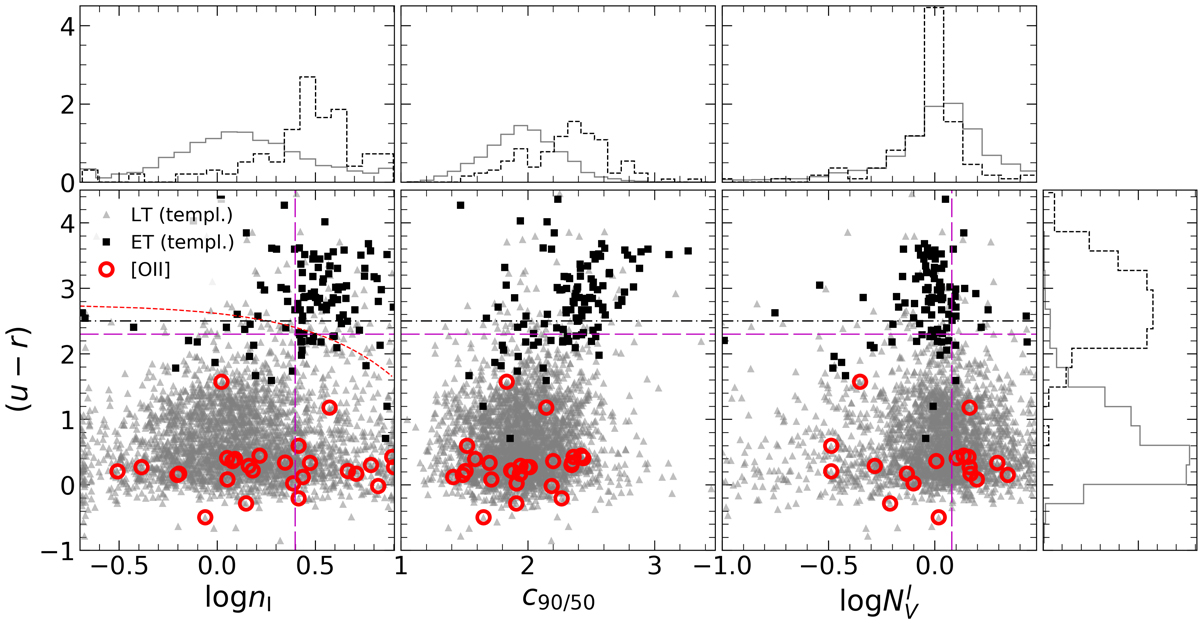
Fig. 5.
Observed (u − r) colour versus morphological parameters for all the sources of OTELO. From left to right: logarithm of the Sérsic index in the filter F814W (I), concentration index for the I filter too, and the logarithm of the wavelength-dependent ratio of the Sérsic indices for I and V (F606W). Triangles and solid lines in grey (histograms) represent LT, squares and dashed lines in black (histograms) represent ET galaxies. Red circles represent the [O II]3727 emitters from our sample with HST/ACS ancillary data. Top histograms corresponds to the respective value, as indicated in x-axis label, while right-hand histogram show (u − r) distribution. All histograms represents density distributions. Horizontal dot-dashed line in black shows (u − r) = 2.5. Red dashed line shows the results from de Diego et al. (2020). Dashed lines in magenta represent limits from Vika et al. (2015): horizontal cut in (u − r) = 2.3, while vertical dashed-lines in magenta represent log(nI) = 0.4 and ![]() . Figure adapted from Nadolny et al. (2021).
. Figure adapted from Nadolny et al. (2021).
Current usage metrics show cumulative count of Article Views (full-text article views including HTML views, PDF and ePub downloads, according to the available data) and Abstracts Views on Vision4Press platform.
Data correspond to usage on the plateform after 2015. The current usage metrics is available 48-96 hours after online publication and is updated daily on week days.
Initial download of the metrics may take a while.