Fig. 13.
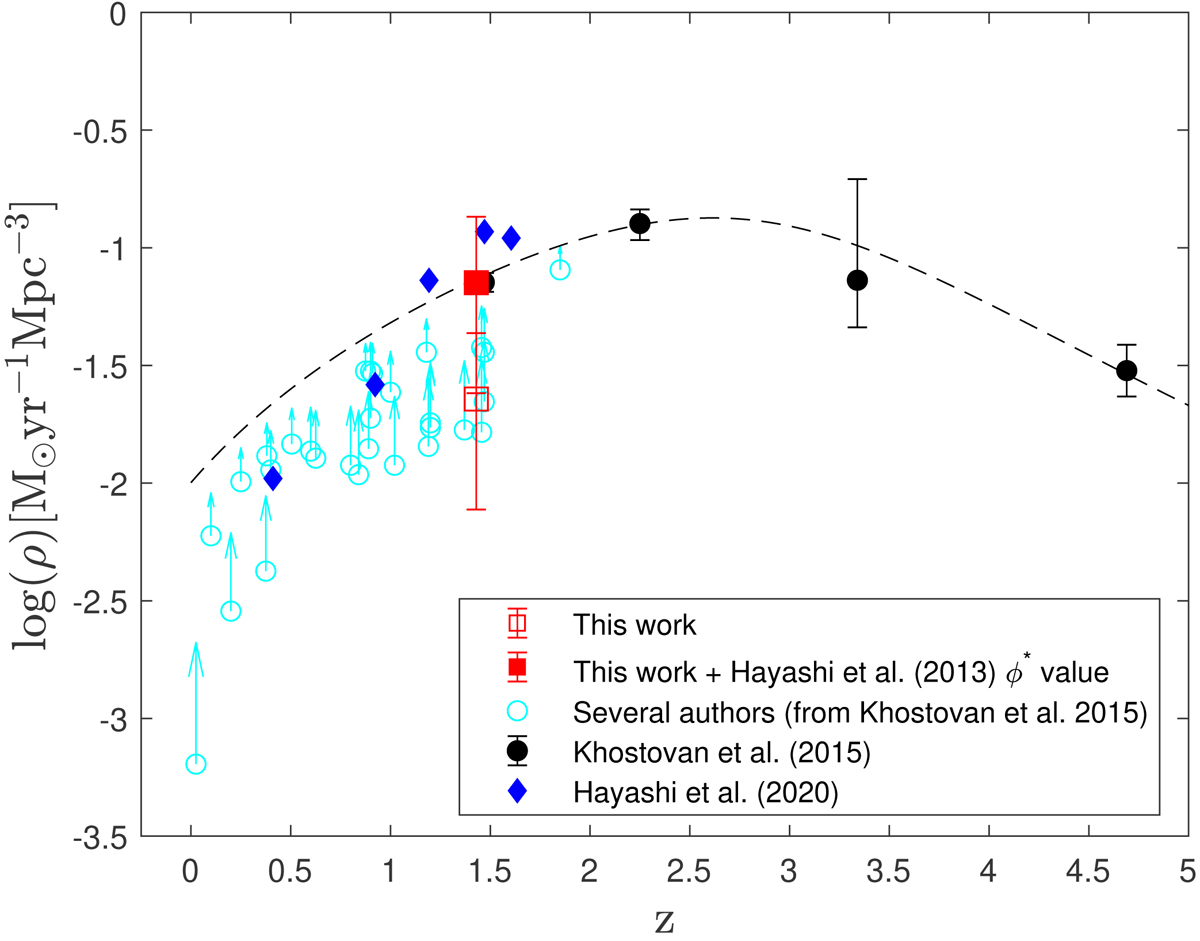
SFRD evolution for several authors. The cyan circles are SFRD derived from [O II]3727, compiled by Khostovan et al. (2015) in the Table C.1 of their paper, and includes data from Ciardullo et al. (2013), Sobral et al. (2012), Bayliss et al. (2012), Ly et al. (2007), Zhu et al. (2009), Takahashi et al. (2007), Glazebrook et al. (2004), Teplitz et al. (2003), Gallego et al. (2002), Hicks et al. (2002), Hogg et al. (1998), and Hammer et al. (1997). We note that these points are not extinction-corrected, so they are a lower limit for the SFRD, as indicated by the cyan arrows. The filled black circles are data from Khostovan et al. (2015). The filled diamonds are data from Hayashi et al. (2020). The result of this work is represented by the open square. The red filled square represents the results of the SFRD from our LF but integrated with the ϕ* from Hayashi et al. (2013). The black dashed line is the [O II]3727 fit to the Khostovan et al. (2015) data, following the parametrisation of Madau & Dickinson (2014).
Current usage metrics show cumulative count of Article Views (full-text article views including HTML views, PDF and ePub downloads, according to the available data) and Abstracts Views on Vision4Press platform.
Data correspond to usage on the plateform after 2015. The current usage metrics is available 48-96 hours after online publication and is updated daily on week days.
Initial download of the metrics may take a while.