Fig. 11.
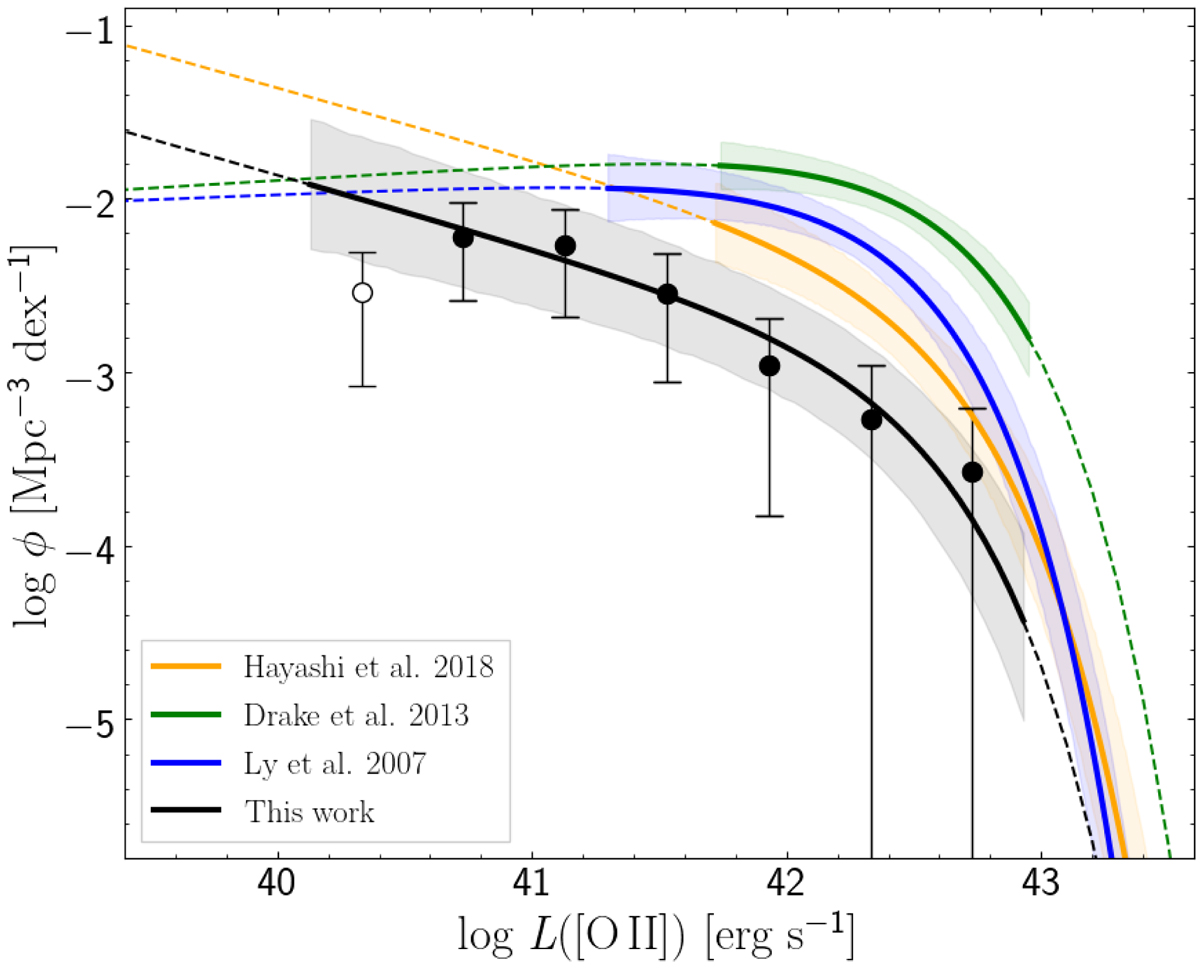
Luminosity function for the [O II]3727 emitters at z ∼ 1.43 (black circles), with extinction and completeness corrected. The error bars correspond to the total uncertainties given in Table 4, and obtained as described in the text. The open circle marks the lowest luminosity bin and was not employed in the fitting. The black line is the best error-weighted fit of Schechter (1976) function. The green, blue, and orange lines are the LFs from Drake et al. (2013), Ly et al. (2007), and Hayashi et al. (2013) respectively. The shaded areas represent the propagation of 1σ uncertainties of the tabulated LF after 104 Monte Carlo realisations. For the OTELO data fitting, this propagation includes the standard deviation of the mean L* value. In each case, the solid line extend over the sampled luminosity range (see the right side columns in Table 4) and the dashed line is the extrapolation of the corresponding best fit.
Current usage metrics show cumulative count of Article Views (full-text article views including HTML views, PDF and ePub downloads, according to the available data) and Abstracts Views on Vision4Press platform.
Data correspond to usage on the plateform after 2015. The current usage metrics is available 48-96 hours after online publication and is updated daily on week days.
Initial download of the metrics may take a while.