Fig. 3.
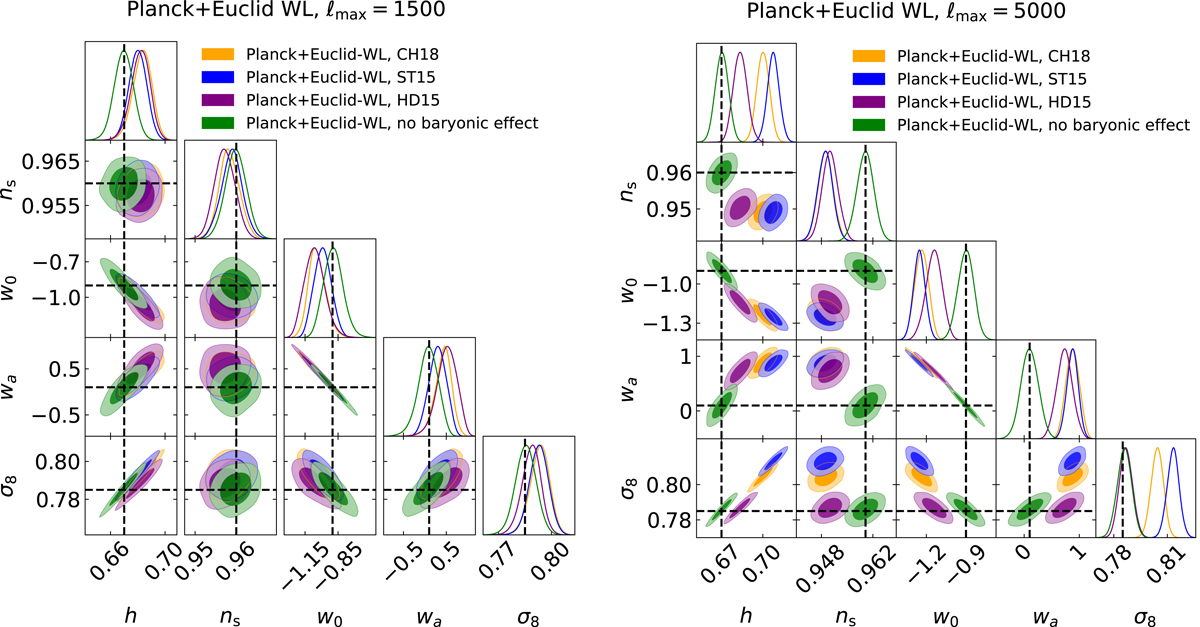
One-dimensional posterior distributions, and 68% and 95% marginalised joint two-parameter contours for w0 and wa, and the parameters h, ns and σ8 from the MCMC analysis. The results are obtained by neglecting baryon effects when fitting mock datasets created without baryonic effects (green) and with baryonic effects (orange for CH18, blue for ST15 and purple for Hd15). The left panel refers to the ℓmax = 1500 case, while the right panel goes deeper into the non-linear regime, with ℓmax = 5000.
Current usage metrics show cumulative count of Article Views (full-text article views including HTML views, PDF and ePub downloads, according to the available data) and Abstracts Views on Vision4Press platform.
Data correspond to usage on the plateform after 2015. The current usage metrics is available 48-96 hours after online publication and is updated daily on week days.
Initial download of the metrics may take a while.