Free Access
Fig. 40
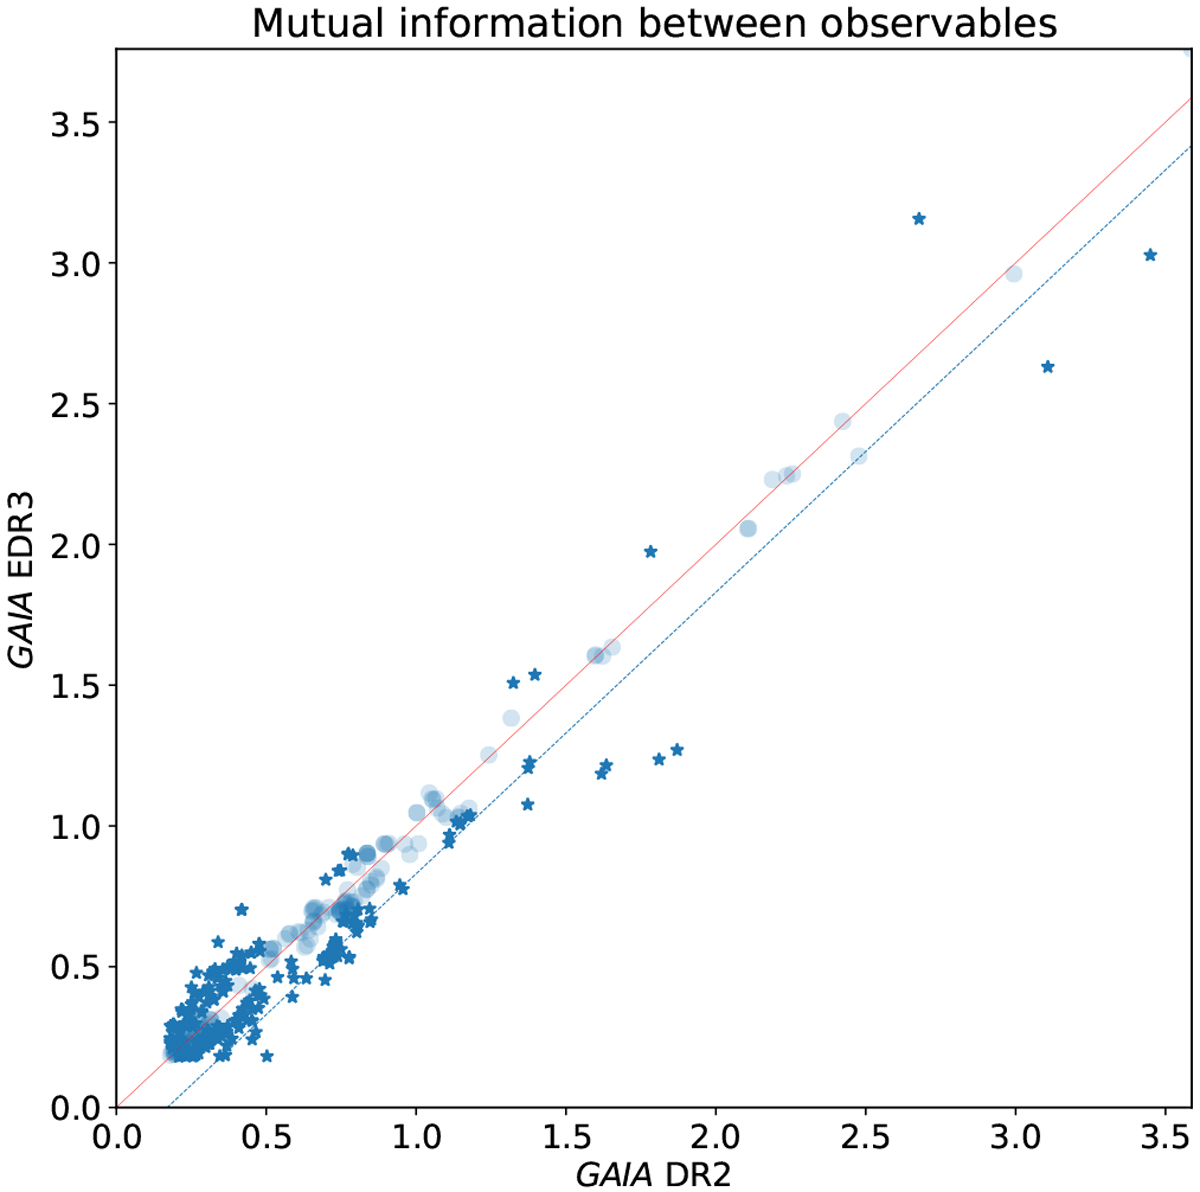
Comparison of 2D KLD between Gaia EDR3 and Gaia DR2. The 1:1 line is shown in red, while subspaces for which KLD was deviated by at least 10% with respect to DR2 are shown as “*”, respectively. The blue dashed line is a guide to thelow KLD sequence at an offset of about 0.17 from the 1:1 line.
Current usage metrics show cumulative count of Article Views (full-text article views including HTML views, PDF and ePub downloads, according to the available data) and Abstracts Views on Vision4Press platform.
Data correspond to usage on the plateform after 2015. The current usage metrics is available 48-96 hours after online publication and is updated daily on week days.
Initial download of the metrics may take a while.