Fig. 37
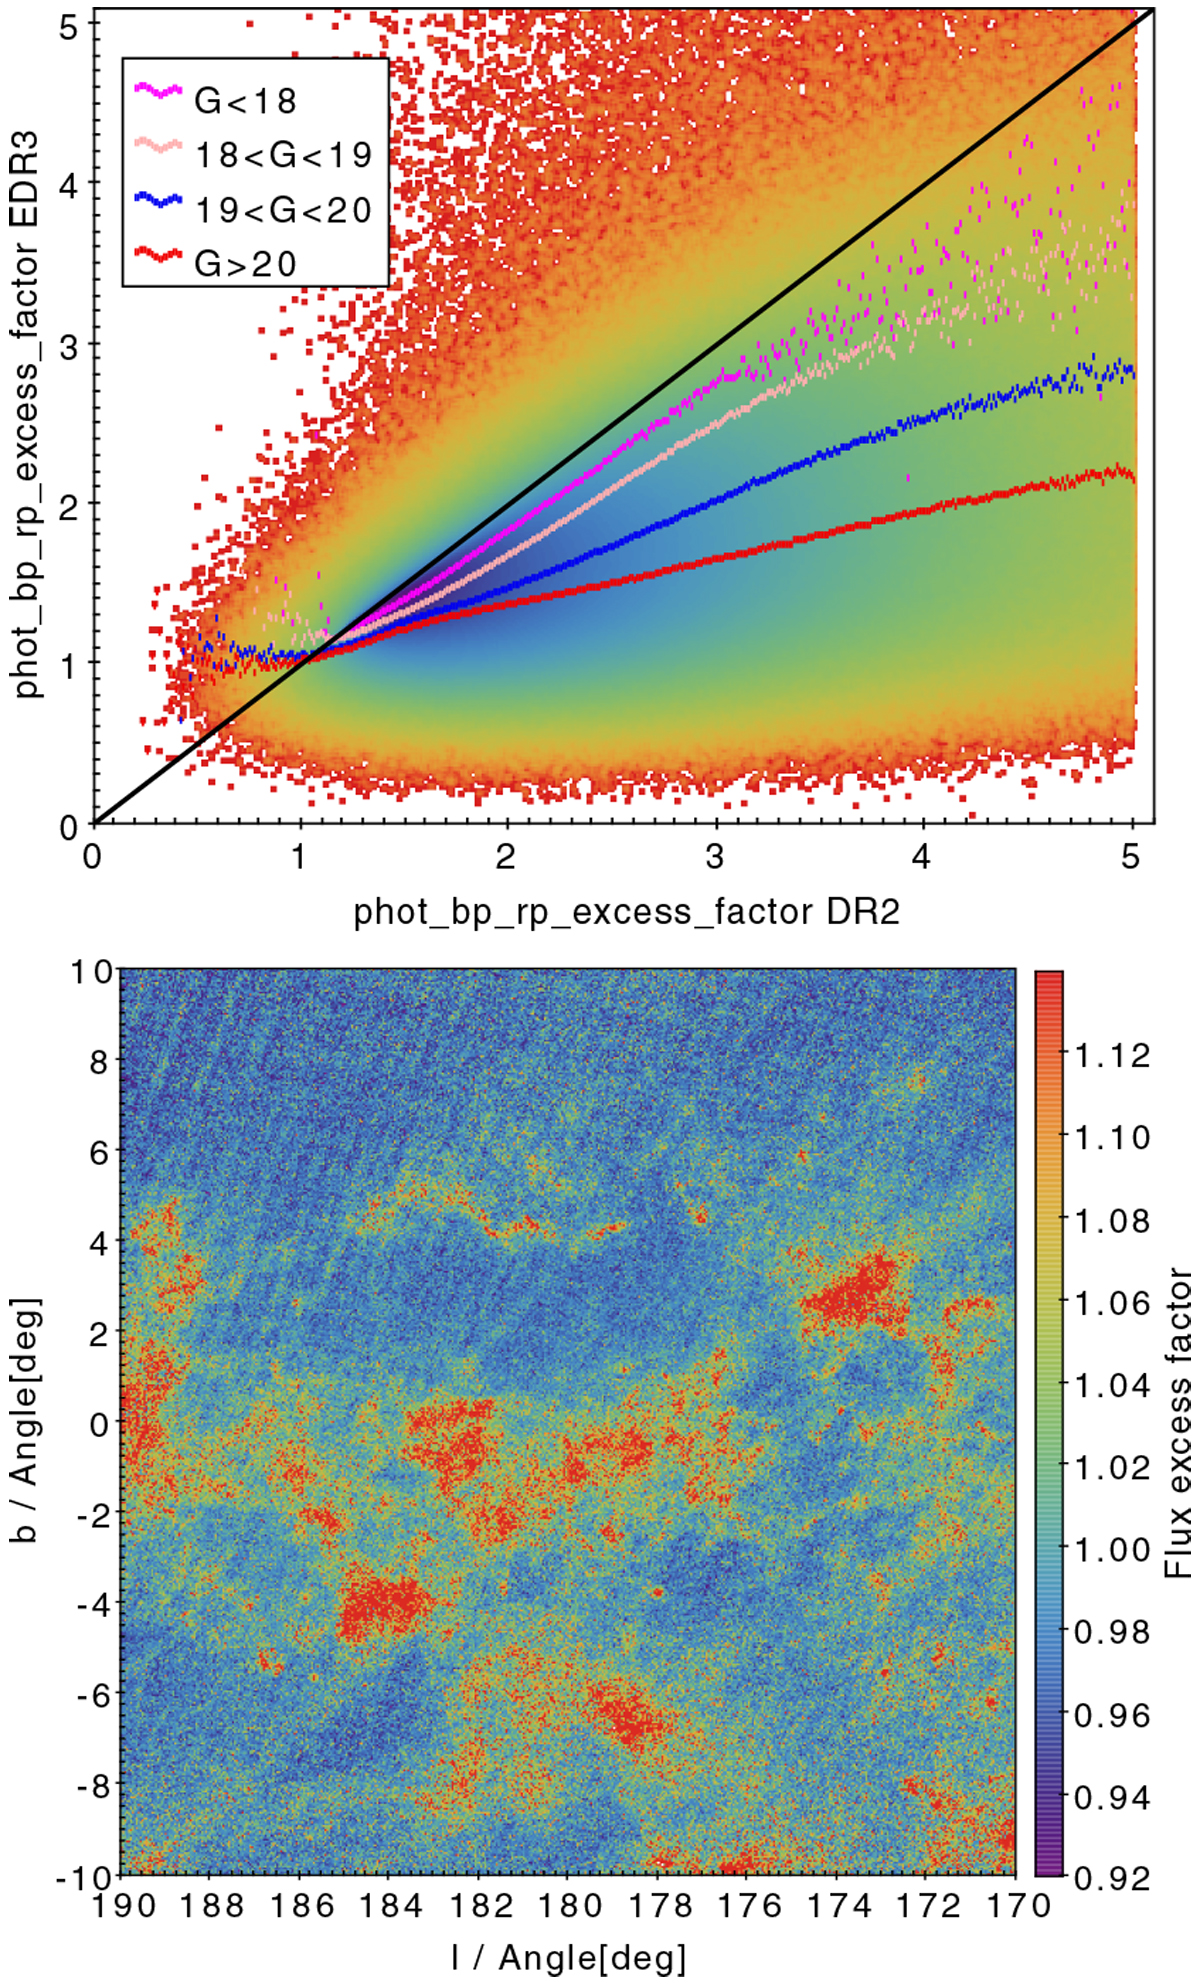
Top:excess flux for 36 million sources towards the direction l ∈ (10°, 20°) and the b ∈ (−5°, 5°) direction. The black line is the identity and the other ones are the median for different ranges of G. Bottom: excess flux for 14 million sources towards the anticentre direction. The colour code accounts for the ratio between the log10 phot_bp_rp_excess_factor and the relation 0.05 + 0.039(GBP − GRP), which is the approximate locus of well behaved stars.
Current usage metrics show cumulative count of Article Views (full-text article views including HTML views, PDF and ePub downloads, according to the available data) and Abstracts Views on Vision4Press platform.
Data correspond to usage on the plateform after 2015. The current usage metrics is available 48-96 hours after online publication and is updated daily on week days.
Initial download of the metrics may take a while.