Free Access
Fig. 30
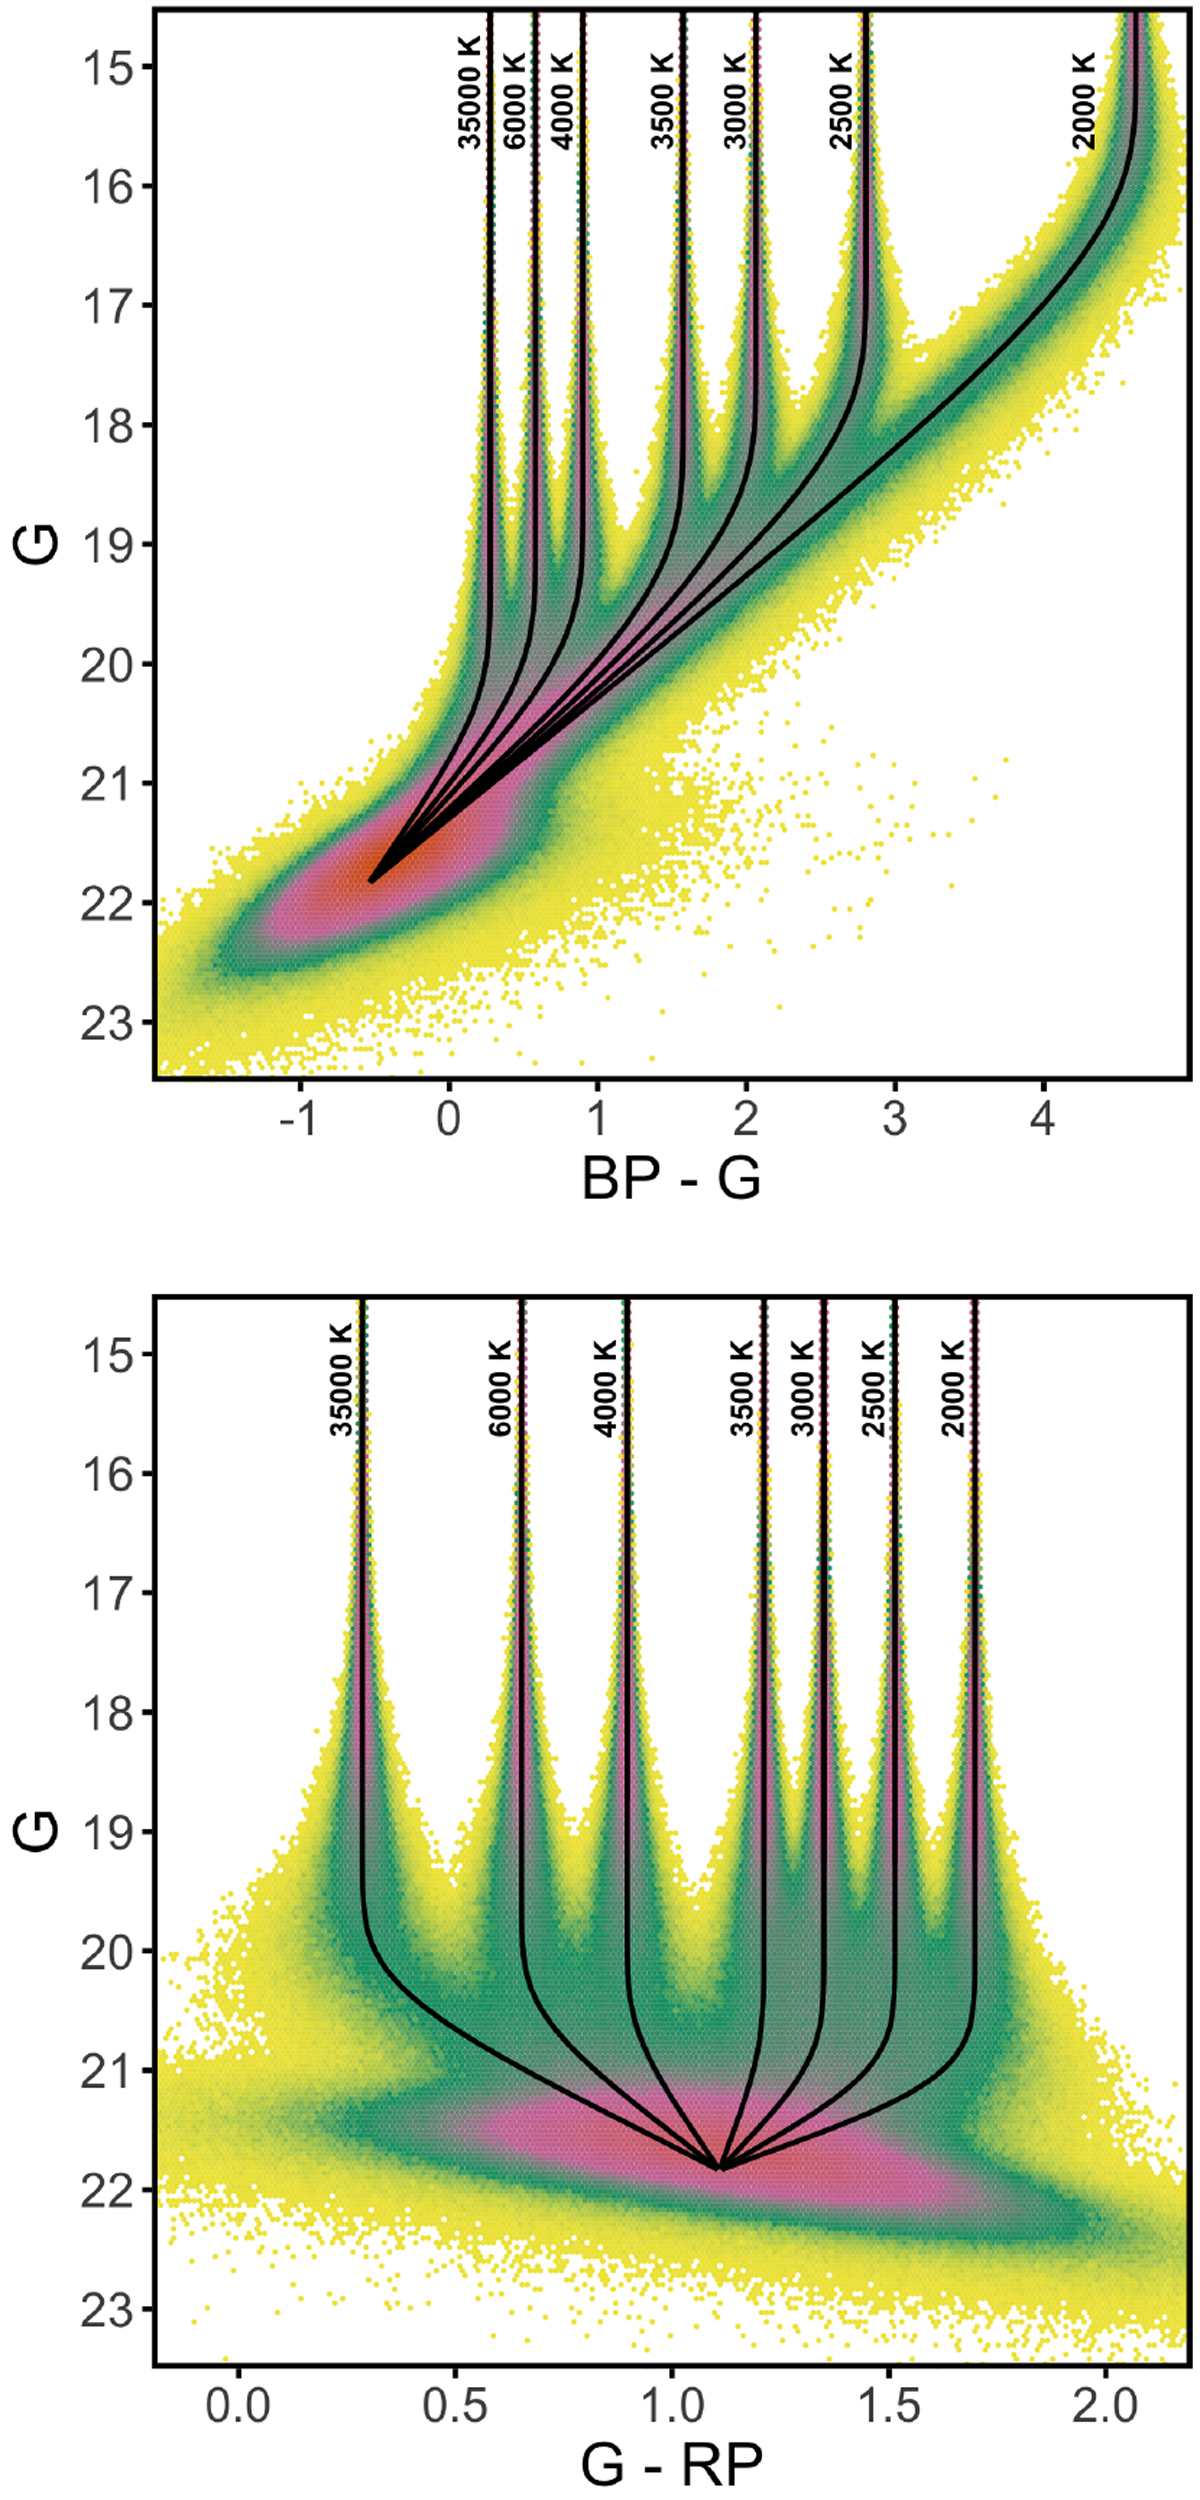
Distribution of 5 million simulated mean magnitudes for BaSeL spectra with effective temperatures from 2000 to 35 000 K, in the presence of a 1 e− s−1 threshold, in the GBP − G versus G (upper panel) and the G − GRP versus G (lower panel) colour-magnitude diagrams. The solid lines indicate the mean.
Current usage metrics show cumulative count of Article Views (full-text article views including HTML views, PDF and ePub downloads, according to the available data) and Abstracts Views on Vision4Press platform.
Data correspond to usage on the plateform after 2015. The current usage metrics is available 48-96 hours after online publication and is updated daily on week days.
Initial download of the metrics may take a while.