Fig. 3
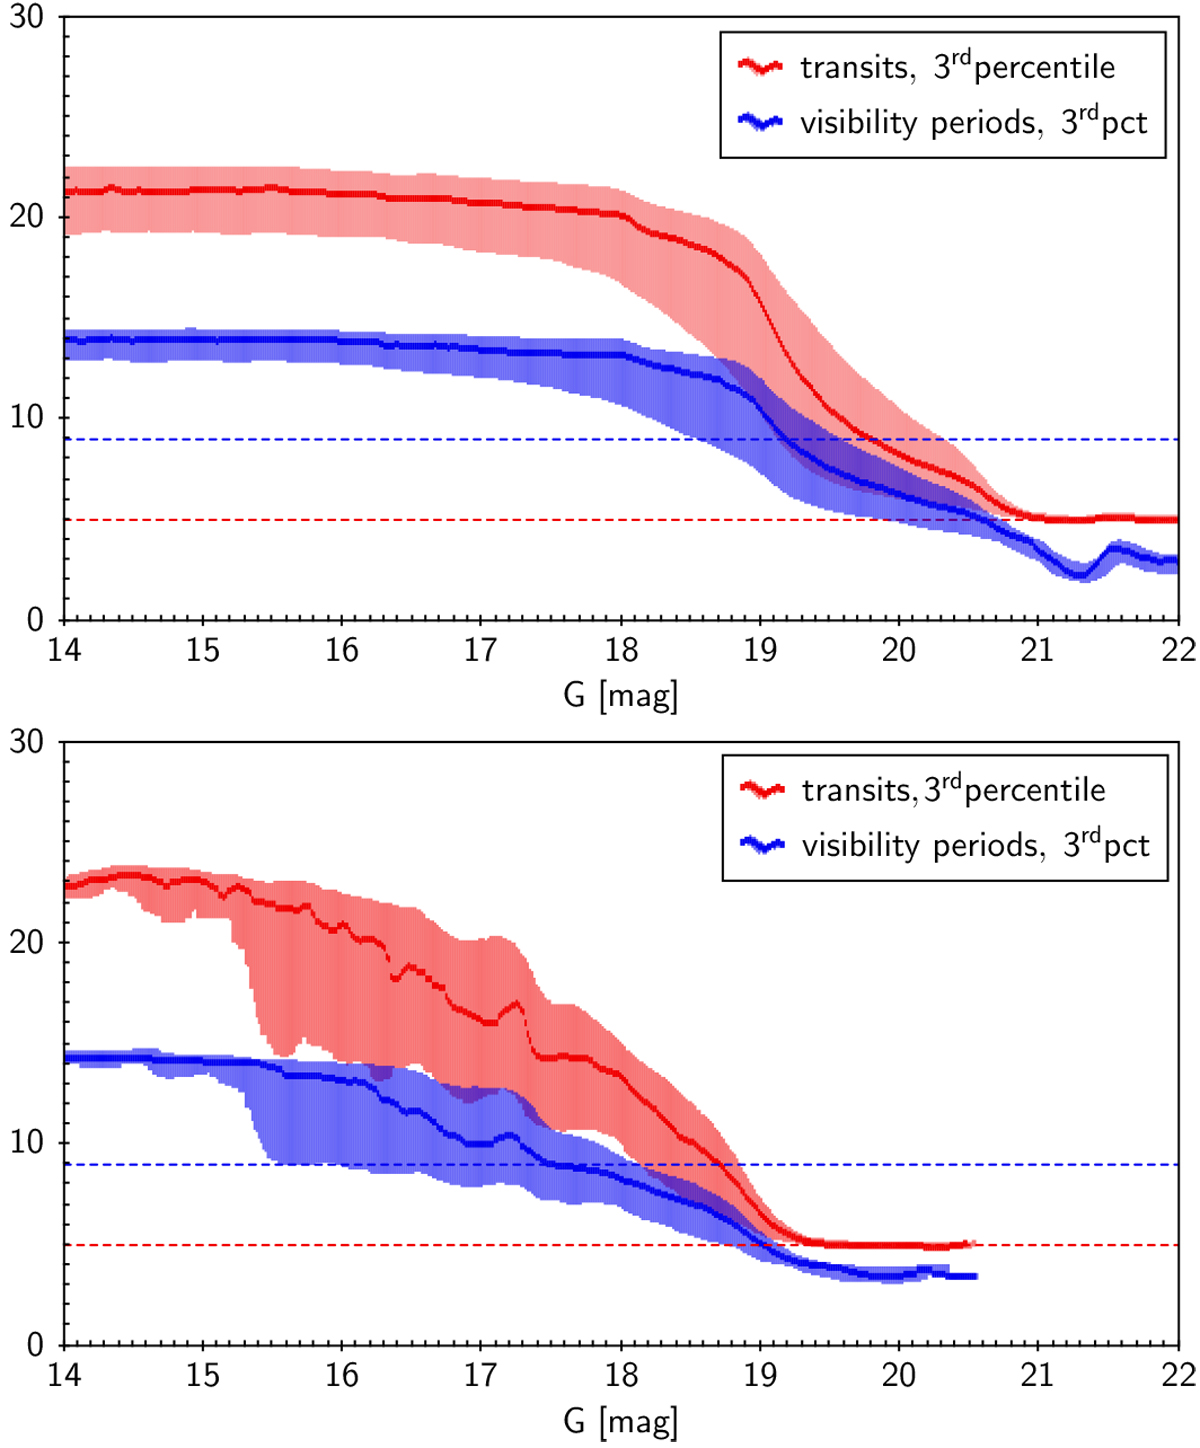
Third percentile of the number of transits and number of visibility periods per source used in the astrometric solution. The shaded areas show the range of the first and fifth percentiles. The limits of five transits for inclusion in the catalogue and nine visibility periods for a full astrometric solution are also indicated. Top: catalogue in general. Bottom: field in Baade’s window.
Current usage metrics show cumulative count of Article Views (full-text article views including HTML views, PDF and ePub downloads, according to the available data) and Abstracts Views on Vision4Press platform.
Data correspond to usage on the plateform after 2015. The current usage metrics is available 48-96 hours after online publication and is updated daily on week days.
Initial download of the metrics may take a while.