Free Access
Fig. 29
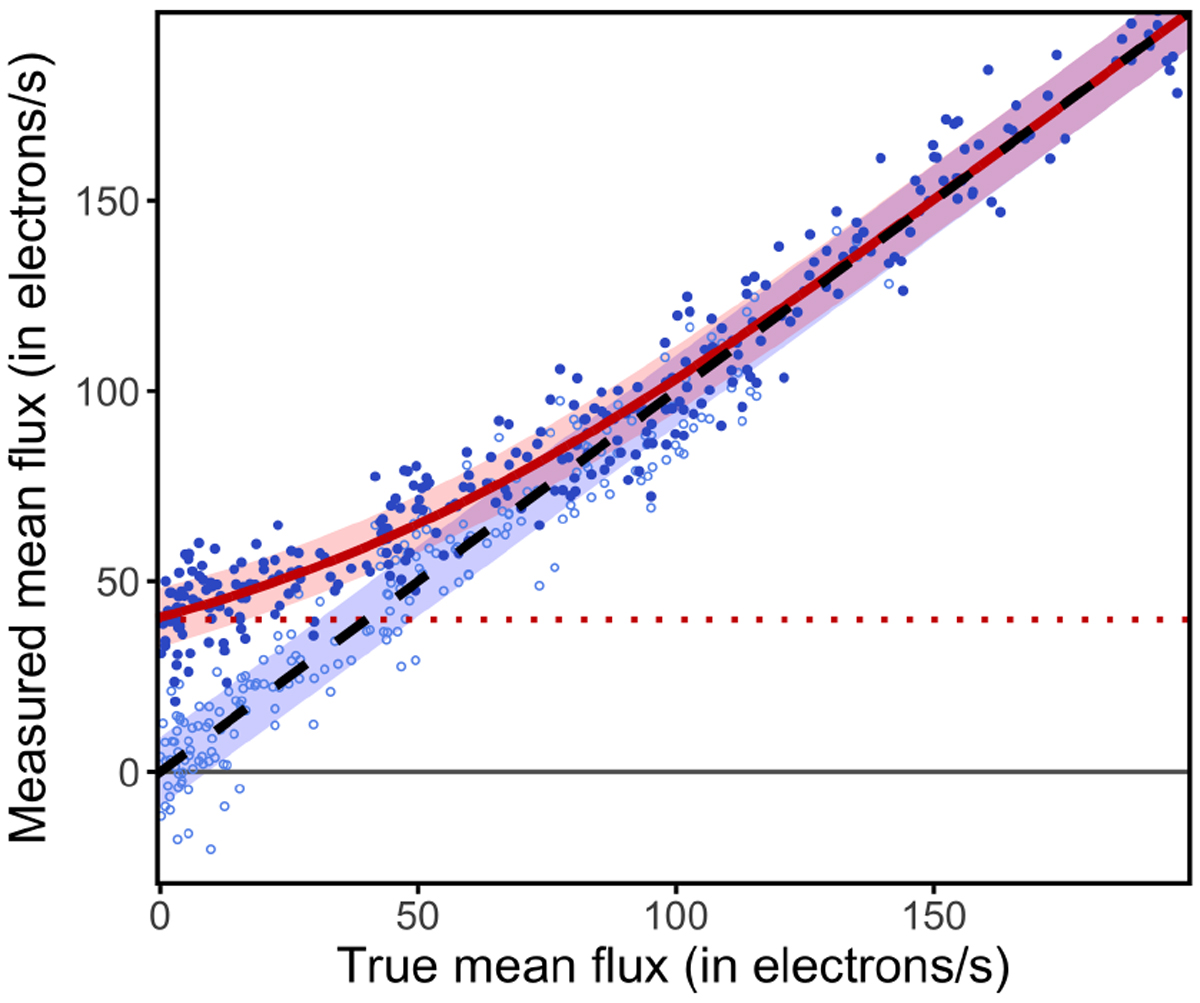
Simulated mean fluxes as a function of the true mean flux in the presence of the 1 e− s−1 threshold (dark filled symbols) and without (light open symbols). The mean and the 1σ confidence intervals are shown as lines and shaded regions. The dotted line indicates the lower bound of the mean in the presence of the threshold.
Current usage metrics show cumulative count of Article Views (full-text article views including HTML views, PDF and ePub downloads, according to the available data) and Abstracts Views on Vision4Press platform.
Data correspond to usage on the plateform after 2015. The current usage metrics is available 48-96 hours after online publication and is updated daily on week days.
Initial download of the metrics may take a while.