Fig. 17
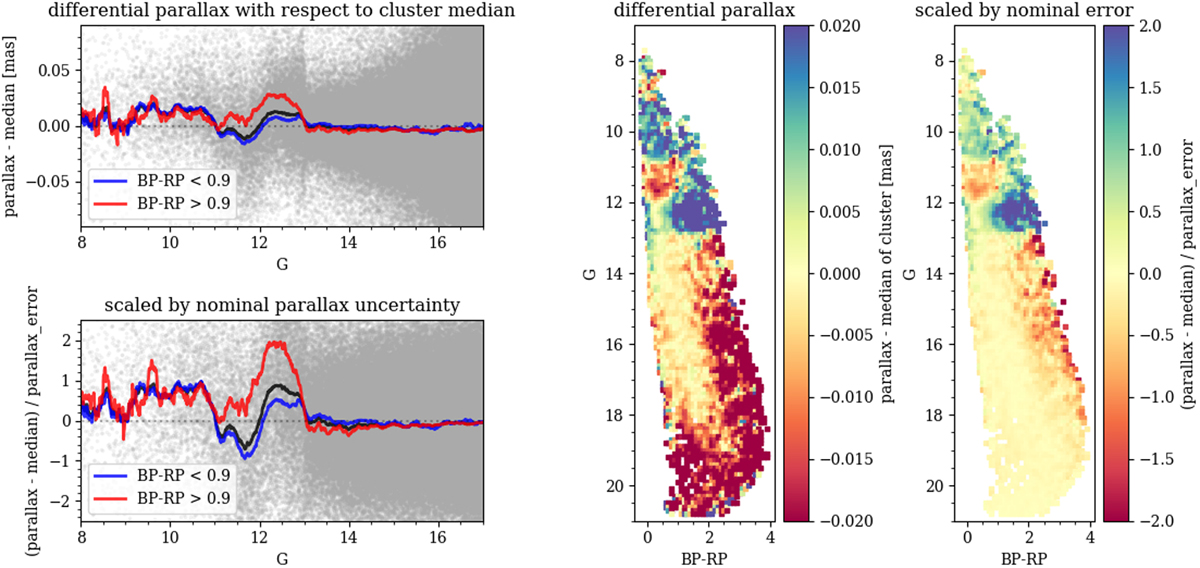
Left: Δϖ (top) and scaled to the nominal uncertainties Δϖ (bottom) versus G for the whole sample of clusters. The solid lines show the LOWESS (locally weighted scatterplot smoothing) of the stars bluer (redder) than GBP − GRP = 0.9 (blue and red lines), while the black line is for the whole sample. Right: CMD of the whole sample where the colour shows the differential parallax to the median.
Current usage metrics show cumulative count of Article Views (full-text article views including HTML views, PDF and ePub downloads, according to the available data) and Abstracts Views on Vision4Press platform.
Data correspond to usage on the plateform after 2015. The current usage metrics is available 48-96 hours after online publication and is updated daily on week days.
Initial download of the metrics may take a while.