Free Access
Fig. 14
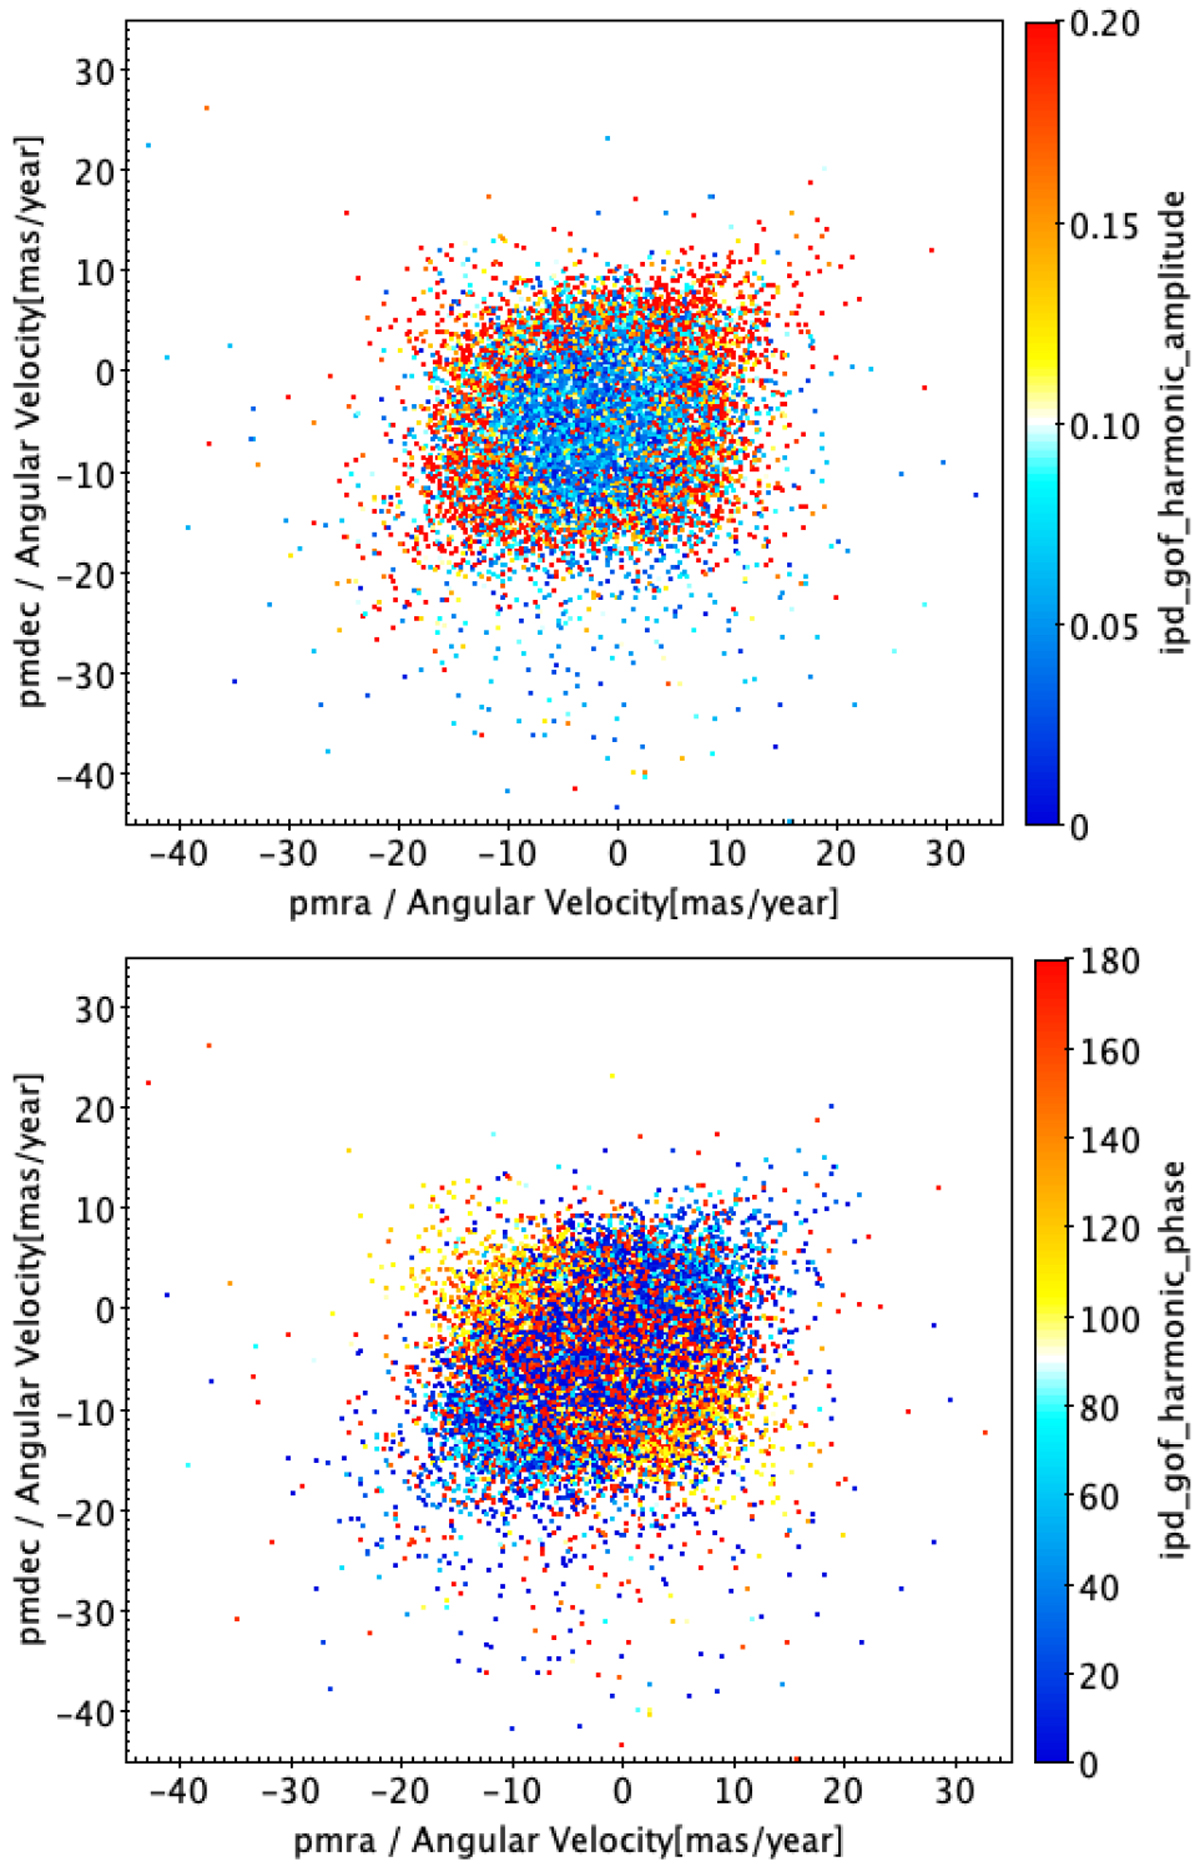
Proper motion diagram of sources near the Galactic centre within a 0.5° radius. Top: colour-coded by ipd_gof_harmonic_amplitude. Bottom: coded by ipd_gof_harmonic_phase. Reddish points in the top panel reveal potentially spurious solutions.
Current usage metrics show cumulative count of Article Views (full-text article views including HTML views, PDF and ePub downloads, according to the available data) and Abstracts Views on Vision4Press platform.
Data correspond to usage on the plateform after 2015. The current usage metrics is available 48-96 hours after online publication and is updated daily on week days.
Initial download of the metrics may take a while.