Fig. 1.
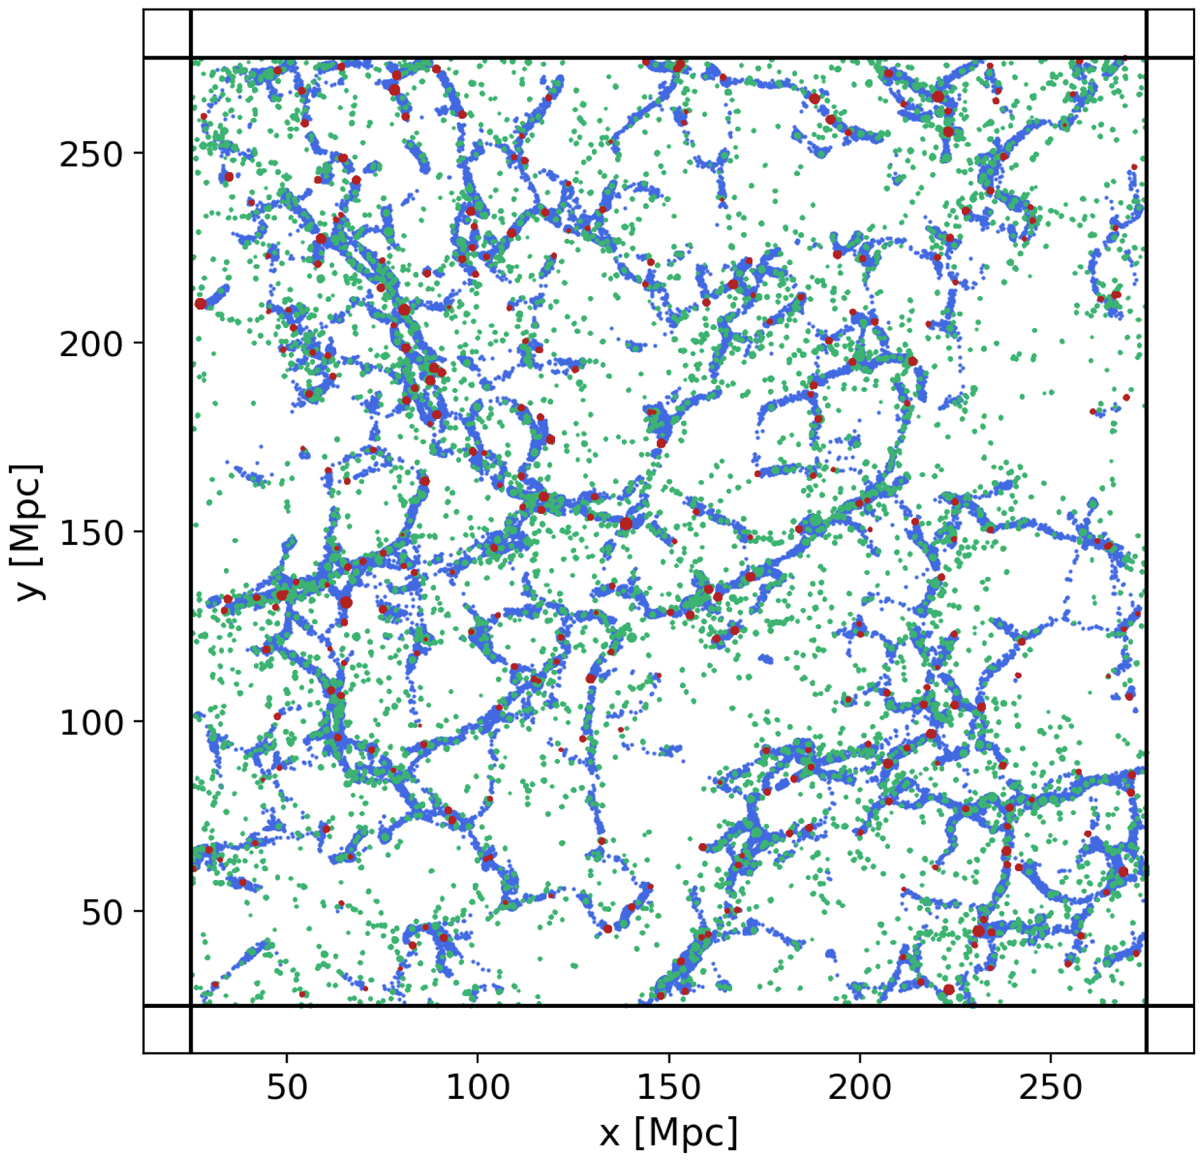
Two-dimensional projection of a slice of thickness 50 Mpc in the xy plane of the TNG300-1 box. The red points correspond to gas cells within the R200 radii of nodes (traced in this work by the DisPerSE maximum density critical points, see Sect. 2.3). The blue points represent gas around filaments, at distances closer than 1 Mpc from the spine of the cosmic web. Finally, the green points show gas in the R200 region of galactic haloes (i.e. within spheres of radius 1 × R200). The galactic haloes residing in filaments are clearly apparent (green over blue regions). The centres of the cells are plotted as points, but the TNG300-1 simulation is described by Voronoi cells having various volumes.
Current usage metrics show cumulative count of Article Views (full-text article views including HTML views, PDF and ePub downloads, according to the available data) and Abstracts Views on Vision4Press platform.
Data correspond to usage on the plateform after 2015. The current usage metrics is available 48-96 hours after online publication and is updated daily on week days.
Initial download of the metrics may take a while.