Free Access
Fig. 10
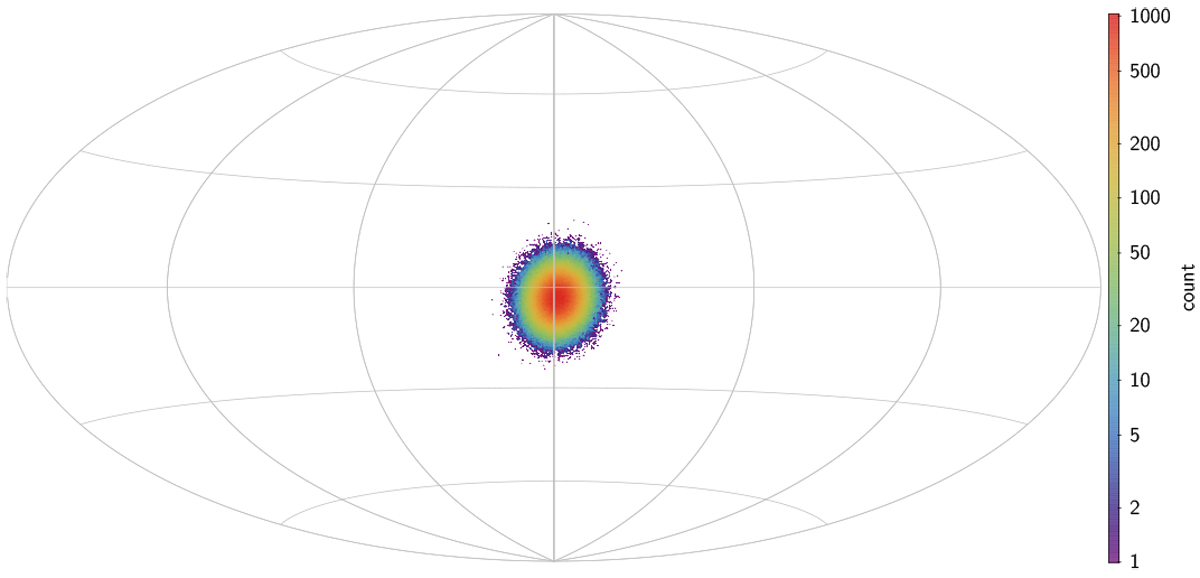
Visualising the error ellipse of the estimated direction of the acceleration estimate in galactic coordinates. The plot is a density map of the directions from 550 000 bootstrap resampling experiments. The colour scale is logarithmic.
Current usage metrics show cumulative count of Article Views (full-text article views including HTML views, PDF and ePub downloads, according to the available data) and Abstracts Views on Vision4Press platform.
Data correspond to usage on the plateform after 2015. The current usage metrics is available 48-96 hours after online publication and is updated daily on week days.
Initial download of the metrics may take a while.