Fig. 9
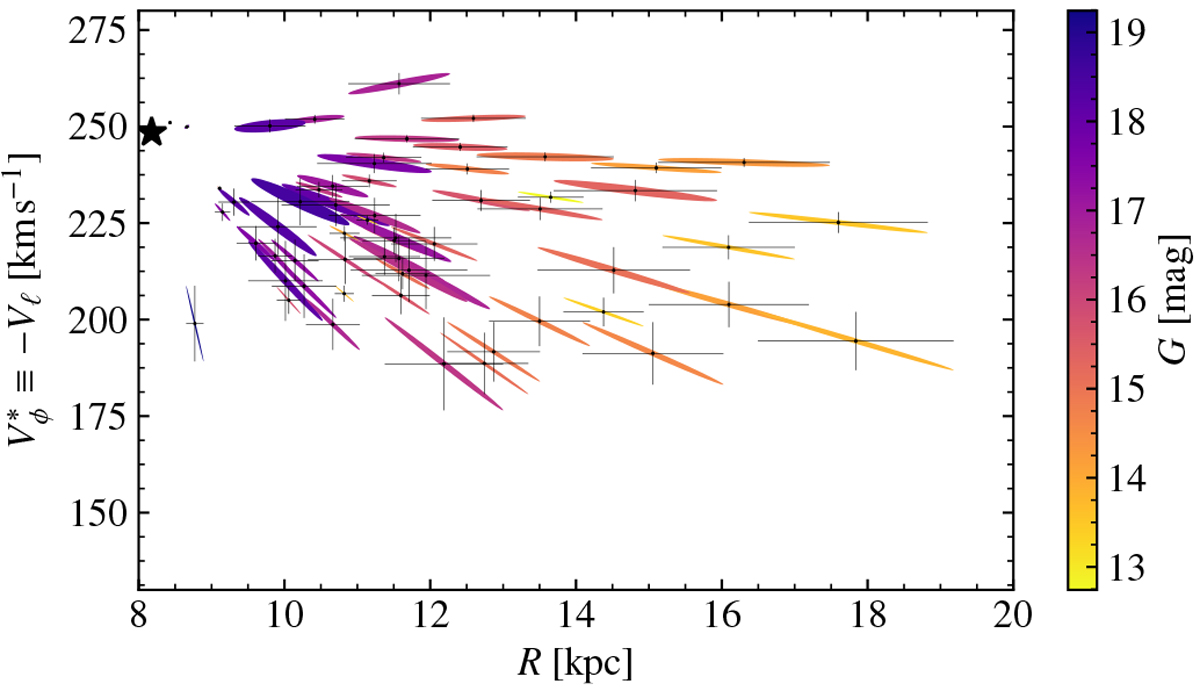
Error ellipses in the R-![]() plane for stars in the anticentre. The ellipses have been drawn for 60 stars from the AC20-ϖ∕σϖ > 3 sample chosen randomly but with weight of expR
in order to sample better the different R. The ellipses are coloured by magnitude G
and the error bars are included as black lines. The error ellipses are oriented pointing towards the
R0 -(vc,⊙ + V⊙) point (blackstar).
plane for stars in the anticentre. The ellipses have been drawn for 60 stars from the AC20-ϖ∕σϖ > 3 sample chosen randomly but with weight of expR
in order to sample better the different R. The ellipses are coloured by magnitude G
and the error bars are included as black lines. The error ellipses are oriented pointing towards the
R0 -(vc,⊙ + V⊙) point (blackstar).
Current usage metrics show cumulative count of Article Views (full-text article views including HTML views, PDF and ePub downloads, according to the available data) and Abstracts Views on Vision4Press platform.
Data correspond to usage on the plateform after 2015. The current usage metrics is available 48-96 hours after online publication and is updated daily on week days.
Initial download of the metrics may take a while.