Fig. 8
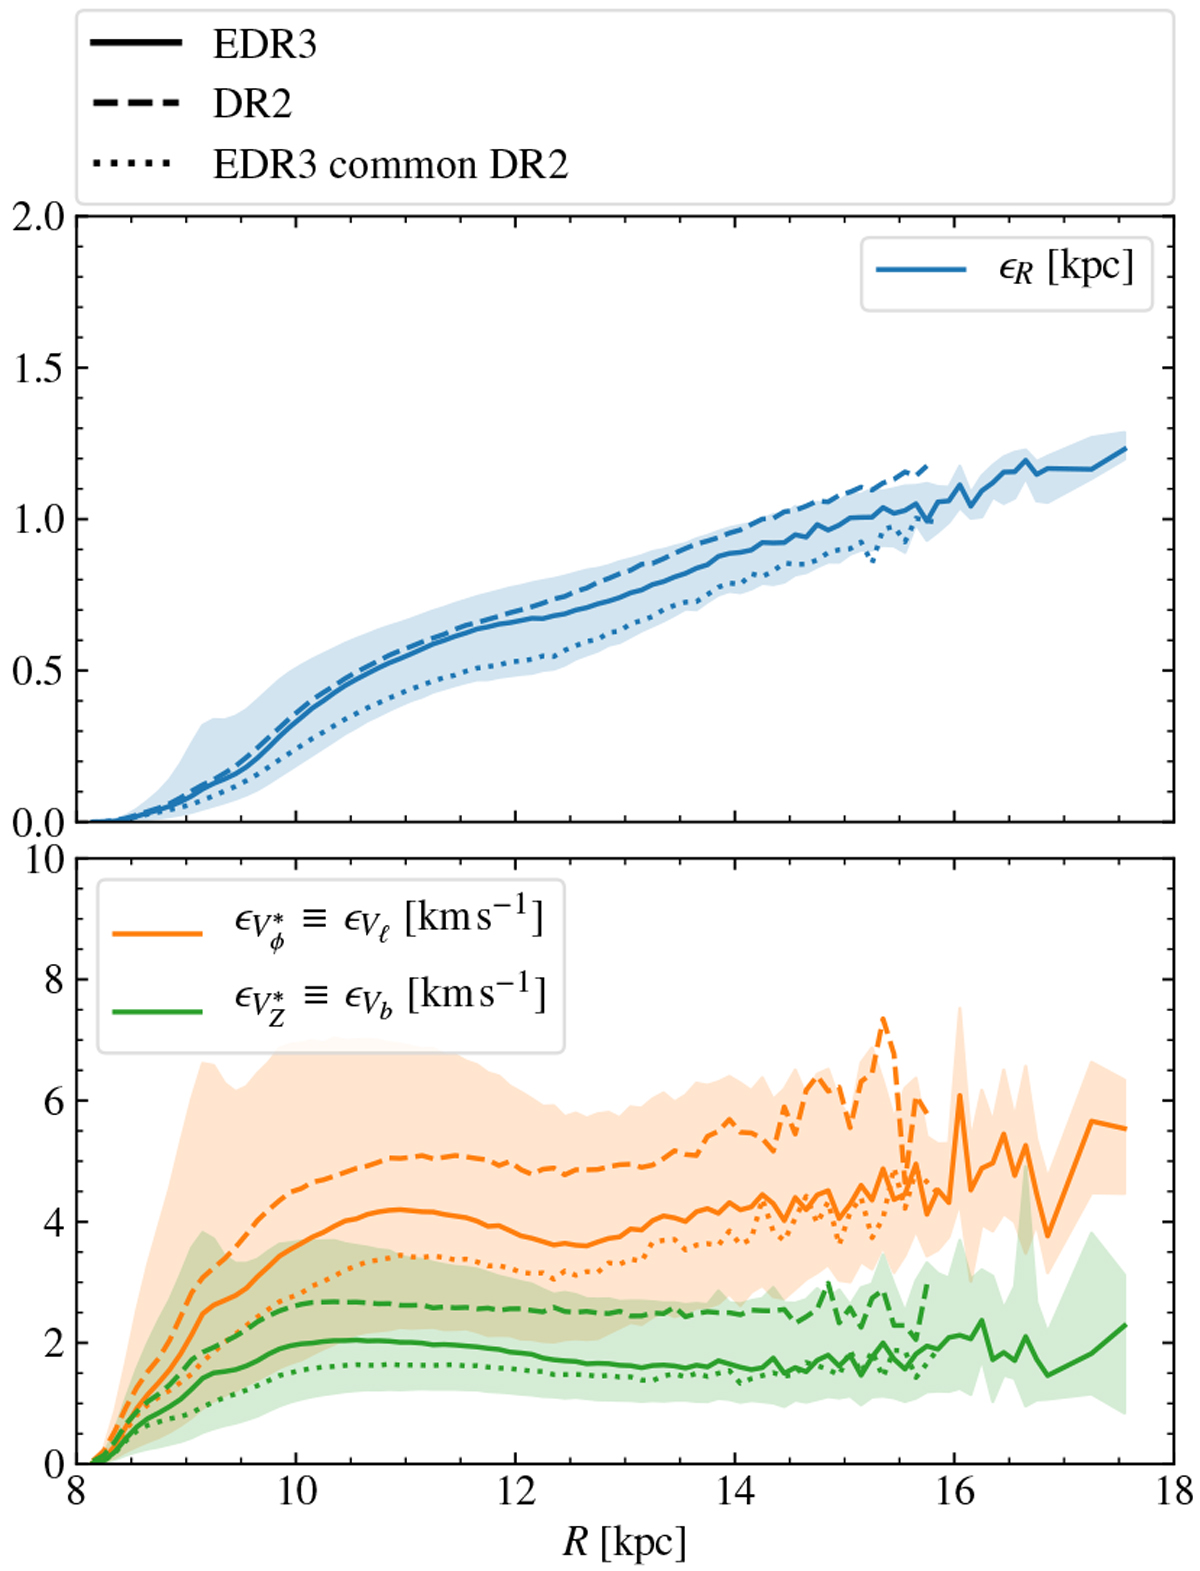
Errors in phase space coordinates in the anticentre. The curves are for the AC20-ϖ∕σϖ > 3 sample and show the median errors for R
(blue) in the top panel, and ![]() (orange) and
(orange) and![]() (green) in the bottom panel, while the shaded regions show areas enclosing 50% of the stars (that is, limited by the 25 and 75 percentiles). We show the values for EDR3 (solid), DR2 (dashed) and sources in common (dotted).
(green) in the bottom panel, while the shaded regions show areas enclosing 50% of the stars (that is, limited by the 25 and 75 percentiles). We show the values for EDR3 (solid), DR2 (dashed) and sources in common (dotted).
Current usage metrics show cumulative count of Article Views (full-text article views including HTML views, PDF and ePub downloads, according to the available data) and Abstracts Views on Vision4Press platform.
Data correspond to usage on the plateform after 2015. The current usage metrics is available 48-96 hours after online publication and is updated daily on week days.
Initial download of the metrics may take a while.