Fig. 6
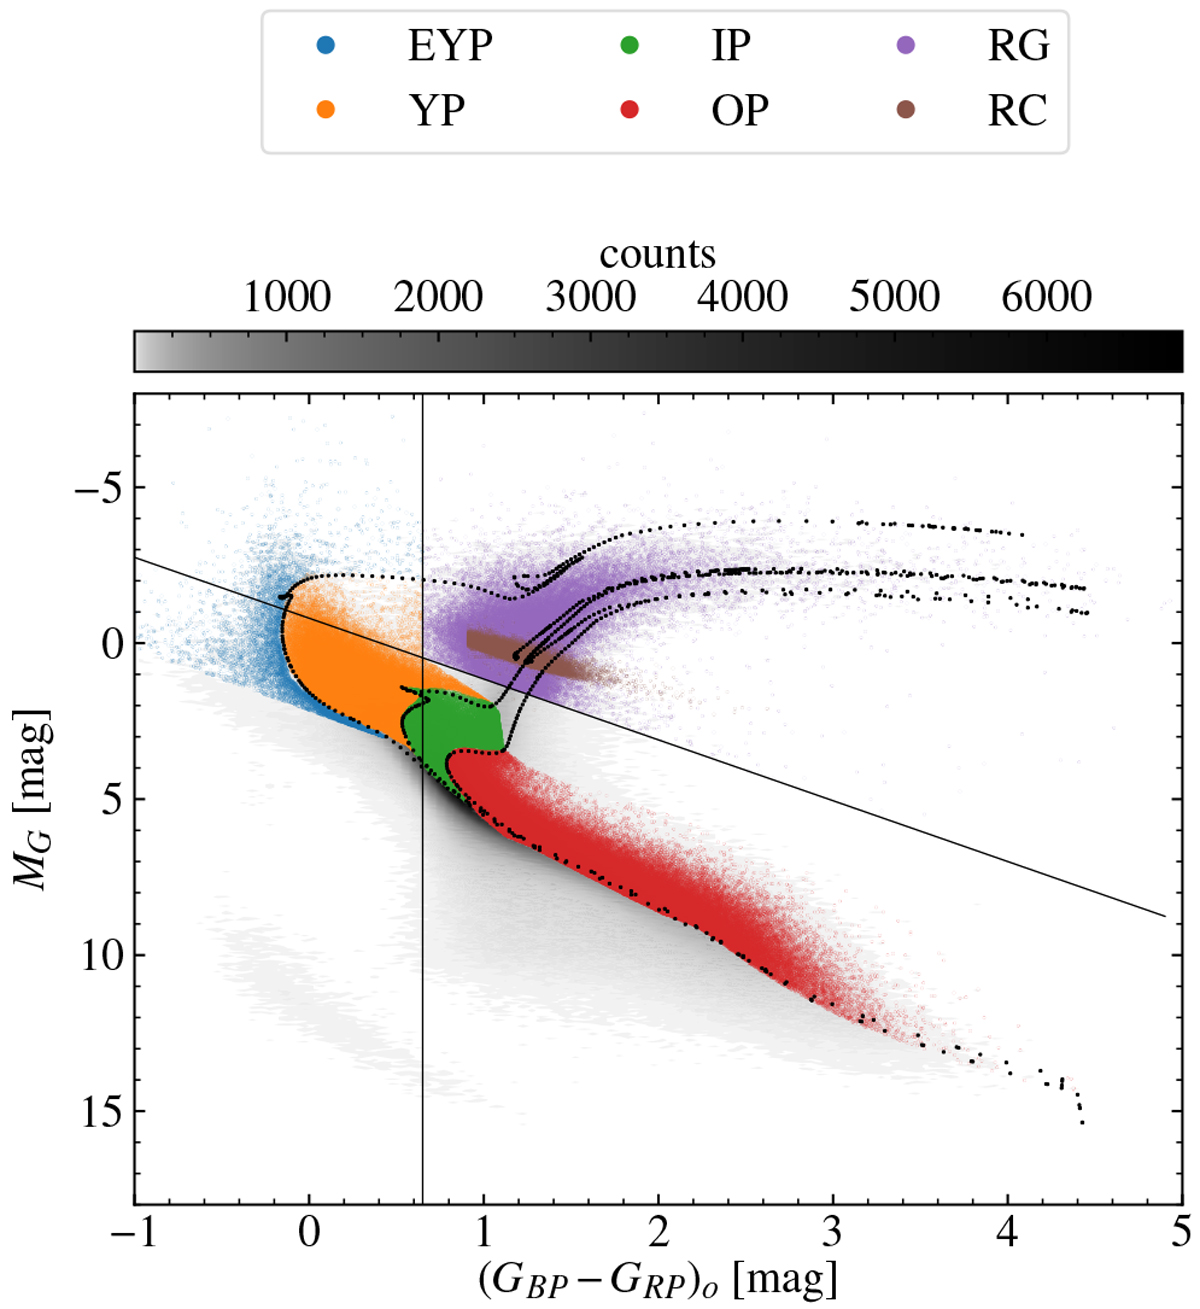
De-reddened HR diagram of the anticentre region and different selected populations. The diagram is shown for the 3 369 456 sources of the AC20-ϖ∕σϖ > 3 sample with available photometry (G, BP, RP) and extinction data and absolute magnitudes derived considering the dPM distances. We over-plot three PARSEC stellar isochrones with [M∕H] = 0 for the ages of 0.2, 2 and 8 Gyr, a line at BP − RP = 0.65 and a diagonal line following the extinction slope used for the selection of populations (Method I) which appear in different colours. The RC have been selected using a different method (Method II).
Current usage metrics show cumulative count of Article Views (full-text article views including HTML views, PDF and ePub downloads, according to the available data) and Abstracts Views on Vision4Press platform.
Data correspond to usage on the plateform after 2015. The current usage metrics is available 48-96 hours after online publication and is updated daily on week days.
Initial download of the metrics may take a while.