Fig. E.8
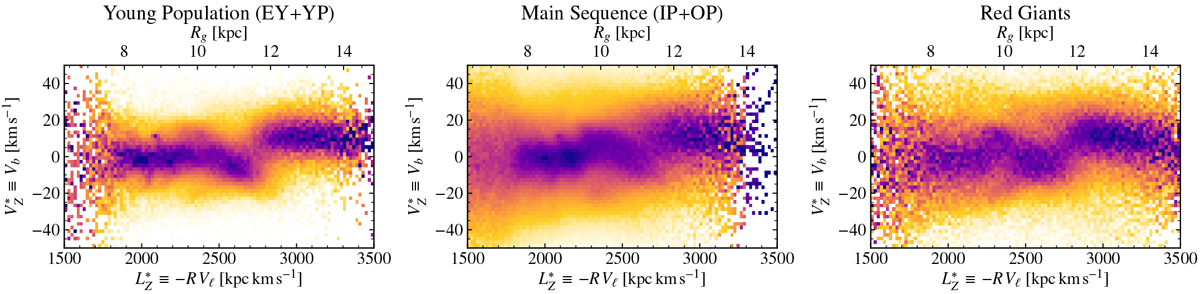
Structures in the vertical velocity and angular momentum space for different populations. As in the top panel of Fig. 15, these show a column normalised histogram of star numbers in the
![]() plane but for a given population (as in Sect. 2.2). In all cases the feature at
~ 2750 km s−1 kpc is clearly visible. The young population has the lowest velocity dispersion, and therefore shows the feature most cleanly.
plane but for a given population (as in Sect. 2.2). In all cases the feature at
~ 2750 km s−1 kpc is clearly visible. The young population has the lowest velocity dispersion, and therefore shows the feature most cleanly.
Current usage metrics show cumulative count of Article Views (full-text article views including HTML views, PDF and ePub downloads, according to the available data) and Abstracts Views on Vision4Press platform.
Data correspond to usage on the plateform after 2015. The current usage metrics is available 48-96 hours after online publication and is updated daily on week days.
Initial download of the metrics may take a while.