Free Access
Fig. E.4
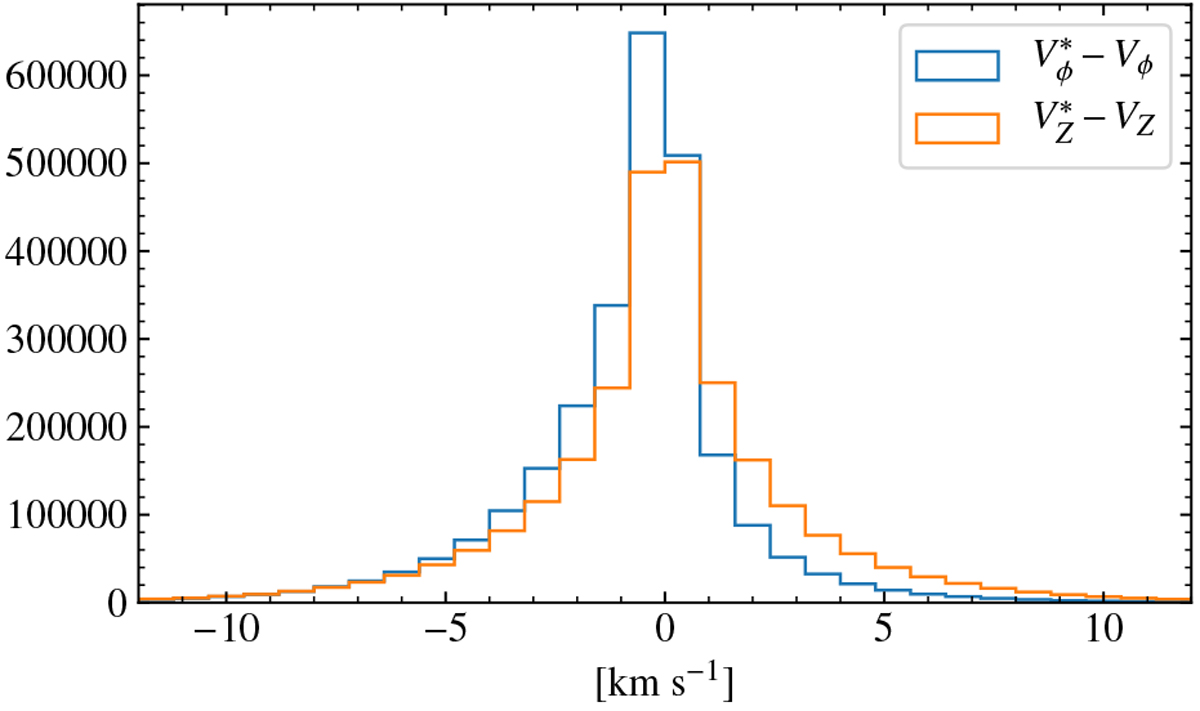
Error in the velocities for GOG when using our approximations (part 2). The histogram of the differences between
![]() and Vϕ, and between
and Vϕ, and between ![]() and VZ is shown. The 10 and 90% percentiles of the differences are −1.5 and 3.9 km s−1
and −3.6 and 3.4 for Vϕ* and for VZ*, respectively.
and VZ is shown. The 10 and 90% percentiles of the differences are −1.5 and 3.9 km s−1
and −3.6 and 3.4 for Vϕ* and for VZ*, respectively.
Current usage metrics show cumulative count of Article Views (full-text article views including HTML views, PDF and ePub downloads, according to the available data) and Abstracts Views on Vision4Press platform.
Data correspond to usage on the plateform after 2015. The current usage metrics is available 48-96 hours after online publication and is updated daily on week days.
Initial download of the metrics may take a while.