Fig. 4
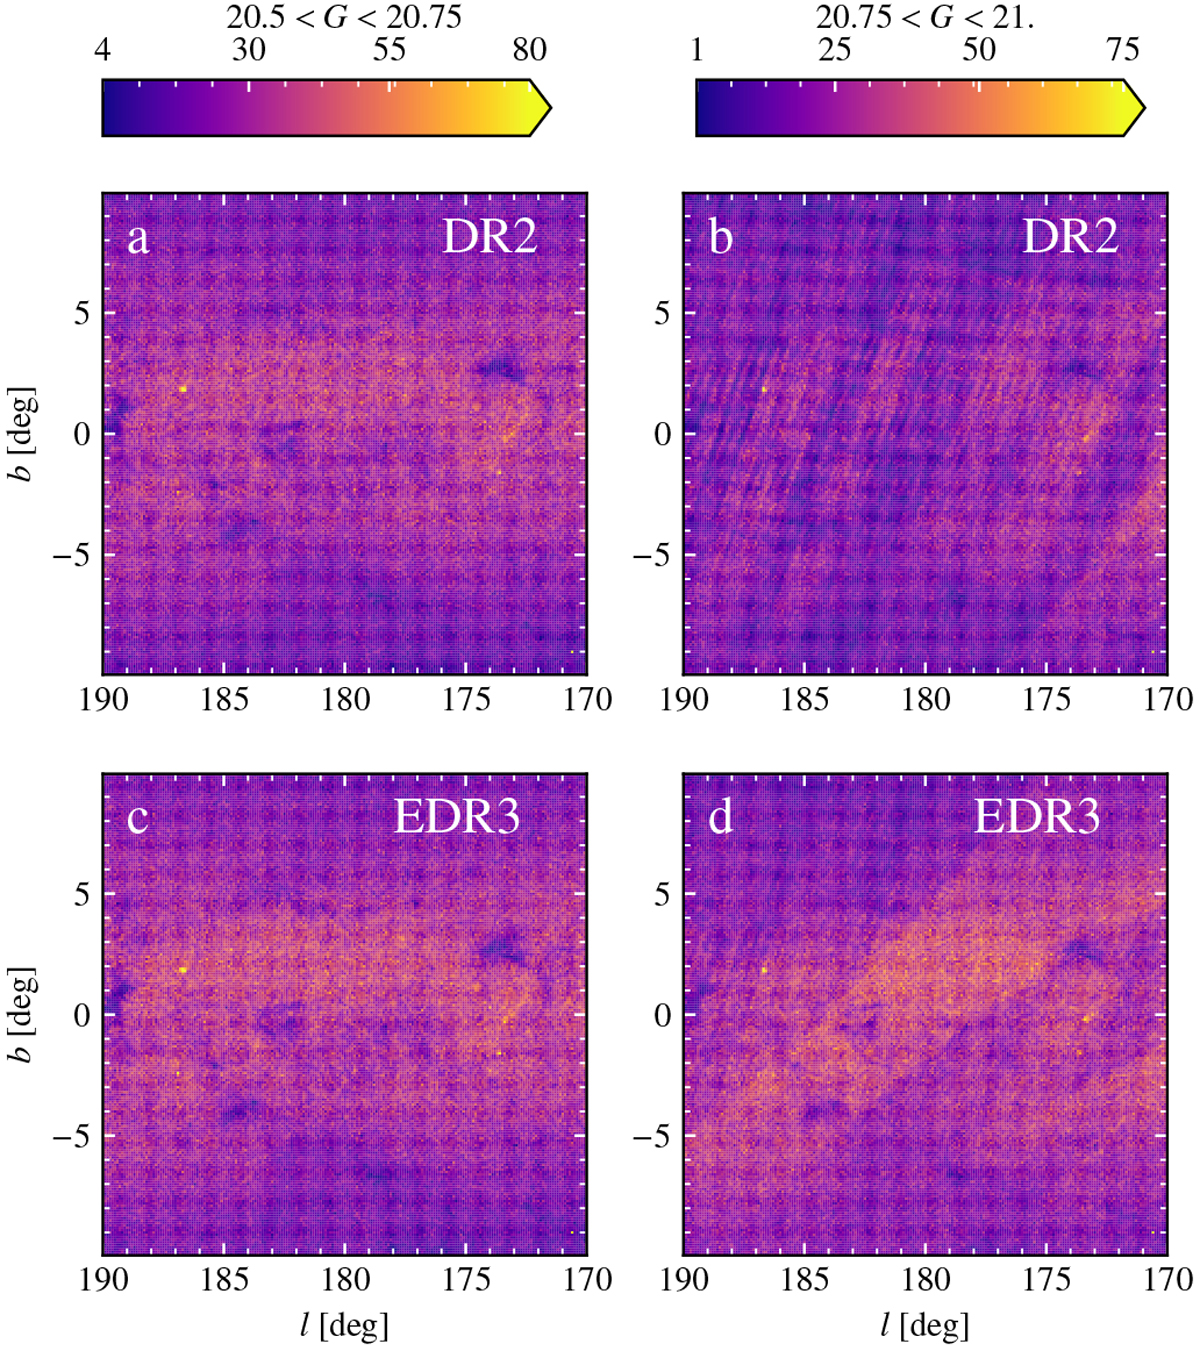
DR2 and EDR3 counts for different magnitude ranges. The panels show the number of sources in bins of 0.1 deg in two different ranges of magnitude: 20.5 < G < 20.75 (left) and 20.75 < G < 21. (right). To facilitate the comparison, the same colour bars has been used for each vertical pair of panels and the upper limit of the colour scale does not correspond to the maximum number of counts to avoid dominance of bins with clusters. An increase in the counts in EDR3 is observed, together with the decrease of some of the small scale patterns, although some bands remain in the faintest magnitude range.
Current usage metrics show cumulative count of Article Views (full-text article views including HTML views, PDF and ePub downloads, according to the available data) and Abstracts Views on Vision4Press platform.
Data correspond to usage on the plateform after 2015. The current usage metrics is available 48-96 hours after online publication and is updated daily on week days.
Initial download of the metrics may take a while.