Fig. D.3
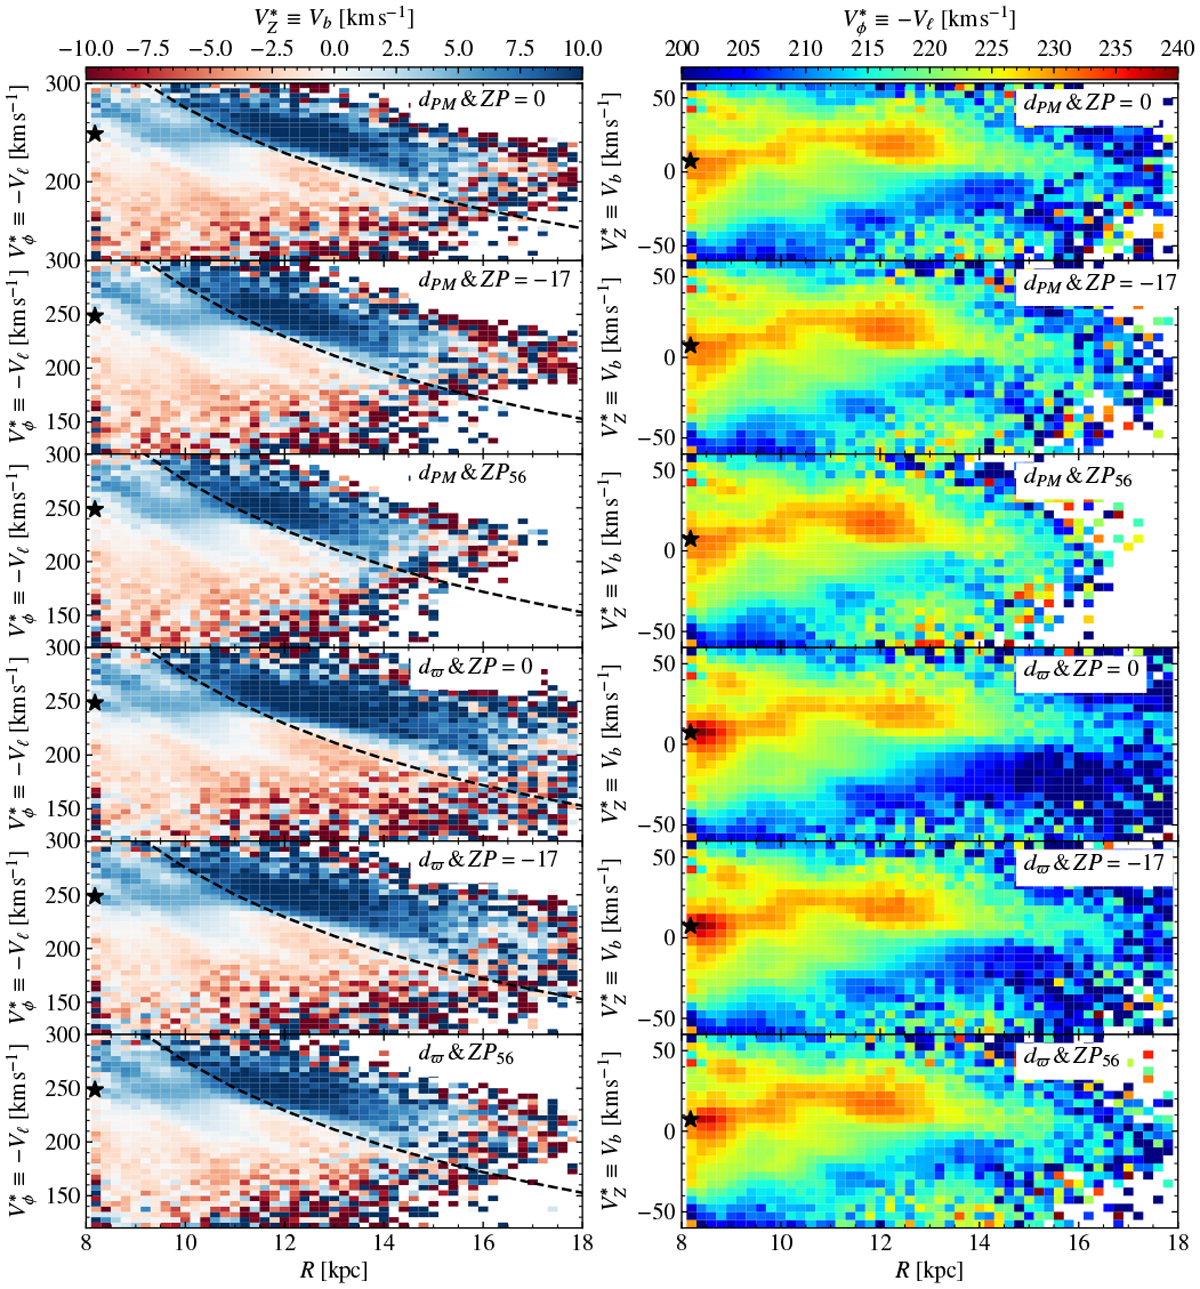
Phase space projections for different parallax zero point. The plot reproduces panels b and e of Fig. 14 using different distance estimations and parallax zero point as indicated in the legends. As explained in other parts of the article, the correction of the zero point combined with the different distance estimators used produce a change in the distance scale but in any case induces or removes the phase space substructure such as the one observed in this panels. The smallest distances are found when the Bayesian distances dPM and the zero point ZP56 are used.
Current usage metrics show cumulative count of Article Views (full-text article views including HTML views, PDF and ePub downloads, according to the available data) and Abstracts Views on Vision4Press platform.
Data correspond to usage on the plateform after 2015. The current usage metrics is available 48-96 hours after online publication and is updated daily on week days.
Initial download of the metrics may take a while.