Fig. D.2
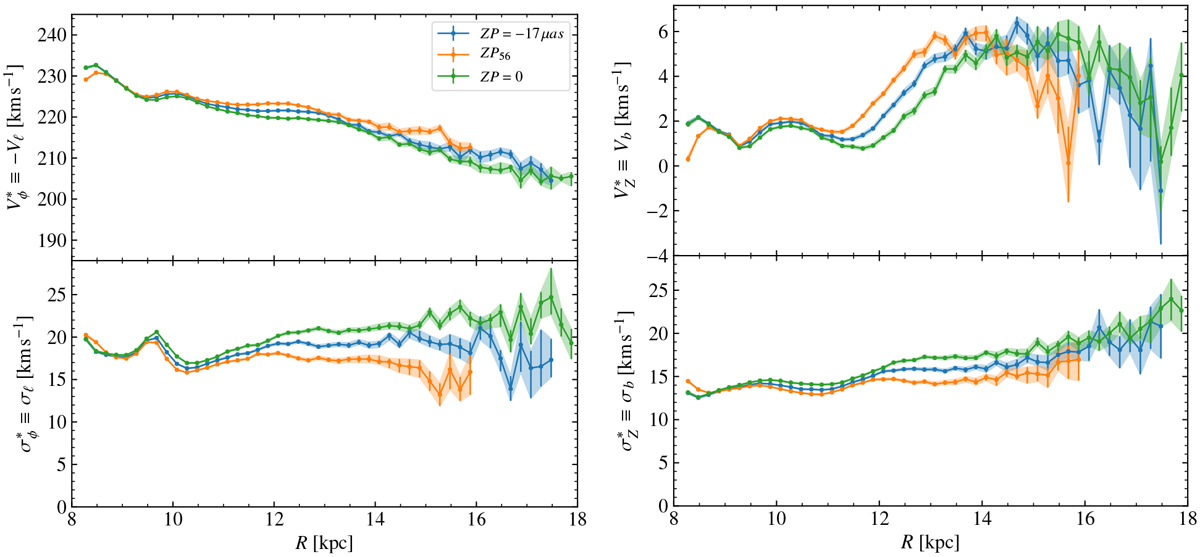
Velocity profiles for different parallax zero points. In the rotation curve (top left), as expected, the rotation curve computed using ZP56 (orange curve) is slightly shifted to the left (R
decreases by about 0.5 kpc at R = 14 kpc) and ![]() also decreases, but always in amounts smaller than ~2 km s−1. In the vertical velocity plot (top right), we observe similar effects, though a notable effect is seen in the first kpc. The velocity dispersions (computed as the
mad
values, bottom) appear also slightly different, with ZP56
yielding smaller dispersions but without changing the overall shape.
also decreases, but always in amounts smaller than ~2 km s−1. In the vertical velocity plot (top right), we observe similar effects, though a notable effect is seen in the first kpc. The velocity dispersions (computed as the
mad
values, bottom) appear also slightly different, with ZP56
yielding smaller dispersions but without changing the overall shape.
Current usage metrics show cumulative count of Article Views (full-text article views including HTML views, PDF and ePub downloads, according to the available data) and Abstracts Views on Vision4Press platform.
Data correspond to usage on the plateform after 2015. The current usage metrics is available 48-96 hours after online publication and is updated daily on week days.
Initial download of the metrics may take a while.