Fig. C.6
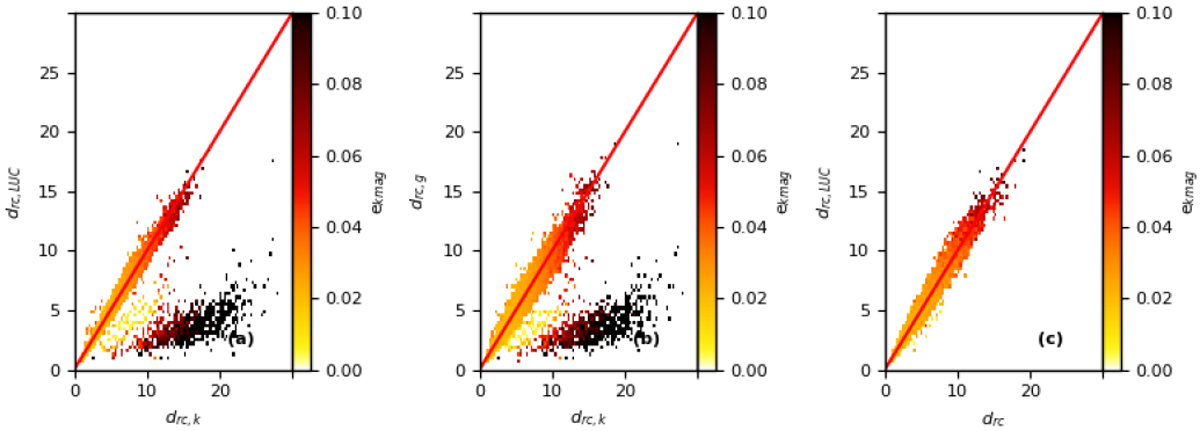
Red clump distance validation with the external catalogue L20. To enhance the illustration we use a larger RC sample here (147 deg < l < 219 deg and |b| < 30 deg). Panel a: comparison to L20 shows the presence of a population for which distances are overestimated using the K band. This isdue to very high photometric errors (i.e. (e_jmag| e_ kmag) > 0.025). (b) Comparison between G and K band derived distances also highlights the same trend: K band distances are overestimated for poor photometry stars. (c) Replacing K band estimates with G where (e_jmag| e_ kmag) > 0.025 improves agreement with L20.
Current usage metrics show cumulative count of Article Views (full-text article views including HTML views, PDF and ePub downloads, according to the available data) and Abstracts Views on Vision4Press platform.
Data correspond to usage on the plateform after 2015. The current usage metrics is available 48-96 hours after online publication and is updated daily on week days.
Initial download of the metrics may take a while.